![derivita-logowhite (2).png]](https://support.derivita.com/hs-fs/hubfs/derivita-logowhite%20(2).png?height=25&name=derivita-logowhite%20(2).png)
What's New in Derivita Analytics — November 2026
This release starts with a new Home page and puts the why next to every readiness number. District, school, and principal views now show attainment beside readiness, with a one-line caption that reads the two together. Teachers and coaches get mastery by student group on more views, and Question Replay now shows the skill each question assesses and how demanding it is. Several scores also read more clearly. The views work the same way they did before, and now show more on the same screen.
Last updated: November 2026
A new Home page
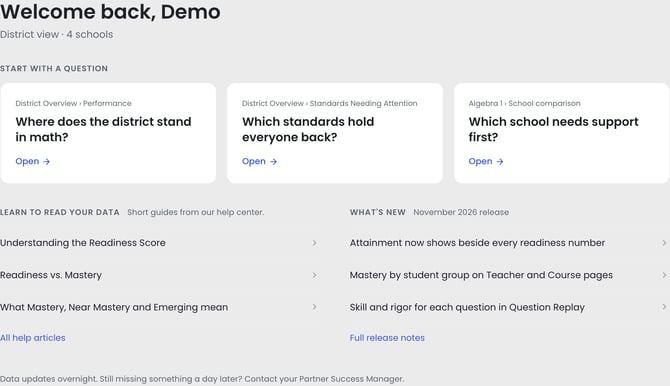
Home now opens on the three questions your role asks most, scoped to your students. A district admin sees Where does the district stand in math?, a principal sees Where is my school strong or weak?, and a teacher sees What do I reteach on Monday? Each card opens the page that answers it. Below the cards, Learn to read your data links short guides from this help center picked for your role, and What's new lists the latest release. The Support button in the top bar is now Help.
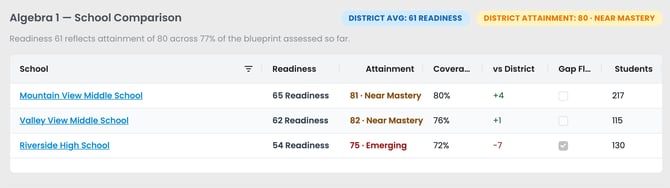
A readiness number on its own doesn't tell you what to do. It could mean students haven't been taught enough of the blueprint yet, or that what's been taught hasn't stuck. Readiness now comes with its reason in more places:
- District Overview: blueprint subjects and the school-by-school drill-down add an Attainment column and a District Attainment badge.
- School page: each blueprint subject card adds an Attainment badge.
- Principal subject view: the header adds an Attainment badge with its band spelled out.
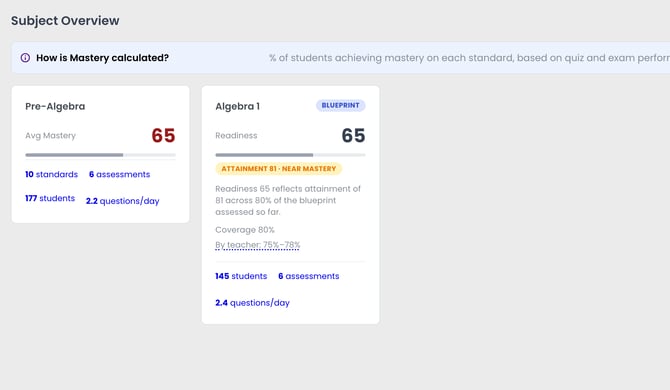
Each view adds a caption that does the reading for you: "Readiness 65 reflects attainment of 81 across 80% of the blueprint assessed so far." If attainment is strong while readiness is lower, there's more of the blueprint left to teach (a pacing gap). If attainment is low, students need a reteach (a mastery gap).
Coverage by teacher. On the School page, each blueprint subject card shows coverage by teacher (e.g. By teacher: 75%–78%). Hover the line to see each teacher's number. A teacher who's behind on the blueprint shows up even when the school-wide coverage looks healthy.
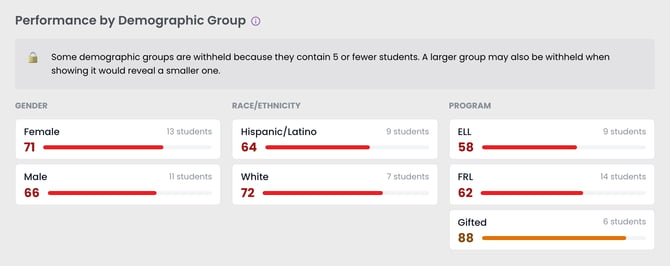
- Performance by Demographic Group is a new section on the Teacher and Course Performance tabs. It shows average standards mastery for each student group (gender, race/ethnicity, program), with one block per subject when a teacher teaches more than one.
- Group gaps on the Teacher and Course Standards Analysis tab flags any student group scoring 10 or more points below the class on a standard. Turn on Show only these to filter the grid to those standards.
- Gaps worth a look on the Teacher and Course Performance tabs lists up to four standards where a group of 10 or more students averages at least 10 points below the class. See standards with gaps opens Standards Analysis filtered to them.
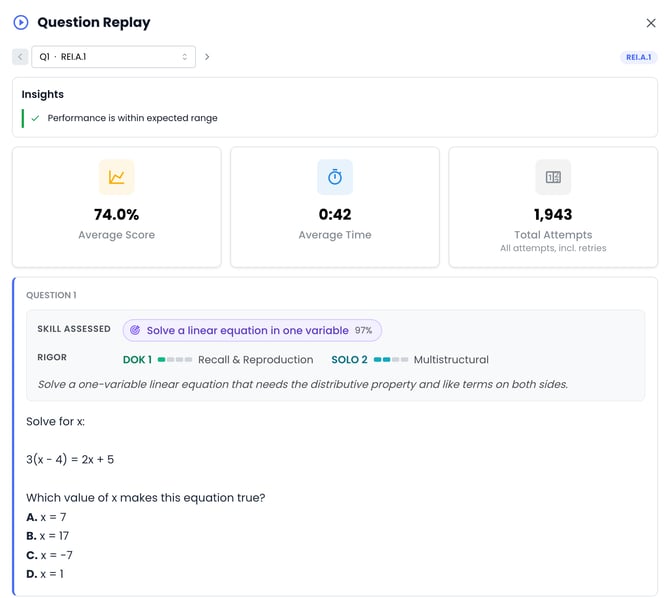
Question Replay, and the Answer Preview you open from a student's answers, now shows the skill the question assesses and its rigor: Depth of Knowledge (DOK) and SOLO level. You can see what an item actually asks of students before deciding what to reteach. On an assignment's Overview, Item Analysis adds a Question mix strip showing the test's DOK balance and how many skills it assesses, and hovering a question shows its skills and rigor. This appears on questions that have been skills-aligned.
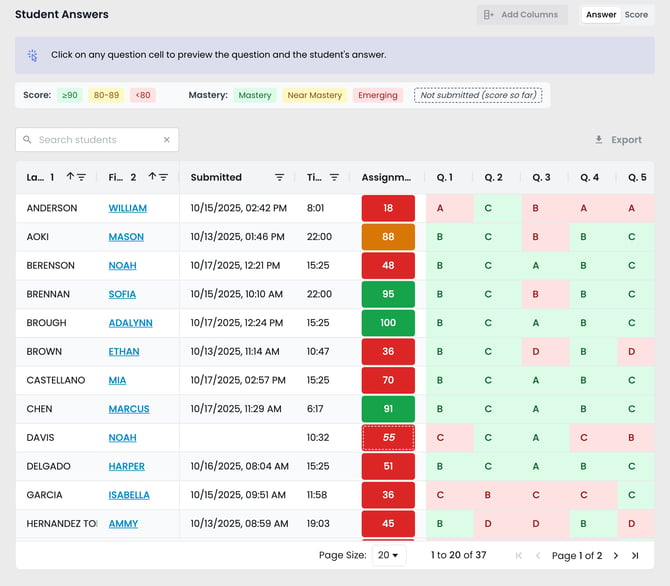
- Unfinished work is marked. On an assignment's Student Answers tab and in the score drill-down, a score from work a student started but hasn't submitted shows dashed and italic, labeled Not submitted (score so far). You can follow up on the submission before reading it as a final score.
- Standard course filter. The Assignment page's Standards Analysis and the PLC Standards Analysis tab can narrow to one course's standards when questions carry standards from several courses. Mastery numbers don't change.
- Unscored students, counted separately. The Standards Analysis grid shows Awaiting Grading and Not Attempted for quiz and exam students with no score yet. Practiced, Not Assessed now counts only students who practiced through homework.
- One name for "no data yet." The gray tier reads Not Evaluated everywhere: donuts, mastery bars, legends, and student grids.
- Help where you need it. Common Assessments and the per-grade Assessment page have ⓘ help icons on the title and on each tab. Each one explains that tab's columns, filters, and panels.
- More accurate counts. On a standard's page, each course counts every student assessed on that standard in that course. A student's Assessments count includes only assessments in the class, school, or PLC you're viewing. PLC Standards Performance ranks standards by each one's overall mastery score.
- Cleaner answer choices. Answer labels in Question Replay and Distractor Analysis display cleanly. When choices start with the same long text, each bar is labeled by its letter; hover for the full answer. Multi-select answers now show every chosen option in full, one per line, and the same set of choices counts as one answer however a student clicked them.
- Focus Areas and Bright Spots agree everywhere. A student's Focus Areas and Bright Spots are the same on their student page and on the Teacher, Course and Blueprint student lists. The Blueprint Students tab shows them as standard pills, and its Focus Areas search matches those pills.
Groups of 5 or fewer students remain hidden to protect student privacy, and that protection now holds in more combinations. Under a demographic filter, a few more cells may show as withheld on these views:
- assignment Comparisons
- the standards-by-group cards
- the PLC course comparison
- the assignment Impact tab
When showing a slightly larger group would let someone work out a smaller one by subtracting, that larger group is withheld too, and the on-screen note says so. Every total and average still includes all students.
See it on your dashboardsThese views were refreshed in this release. Open any of them for the how-to:
- Start from Home: your three questions, guides and what's new
- Where's the district on math?: the Attainment column and caption
- How is my school doing?: the attainment badge and coverage by teacher
- One subject, every angle: the attainment header
- What to do with your students on Monday: Performance by Demographic Group
- This course at a glance: Gaps worth a look
- Find any student on the blueprint: Focus Areas and Bright Spots pills
- Which wrong answers students cluster on: multi-select answers in full
- Every standard, ranked by mastery: Group gaps and the unscored columns
- How did this assignment perform?: Standard course filter, Not submitted, the Question mix strip, and skill in the Answer Preview
- Walk this student's attempt, question by question: skill and rigor in the Answer Preview
- Our assessment program at a glance: the new help icons
- What is Blueprint Readiness?: why readiness, attainment, and coverage are three different numbers
- What's New — August 2026