![derivita-logowhite (2).png]](https://support.derivita.com/hs-fs/hubfs/derivita-logowhite%20(2).png?height=25&name=derivita-logowhite%20(2).png)
For district admins and curriculum coordinators: the Performance tab on District Overview is the one screen that tells you where your math program is on track for the end-of-course exam — and where to send coaching first.
Get there
- In the sidebar, click District Overview.
- You land on the Performance tab (it's the default).
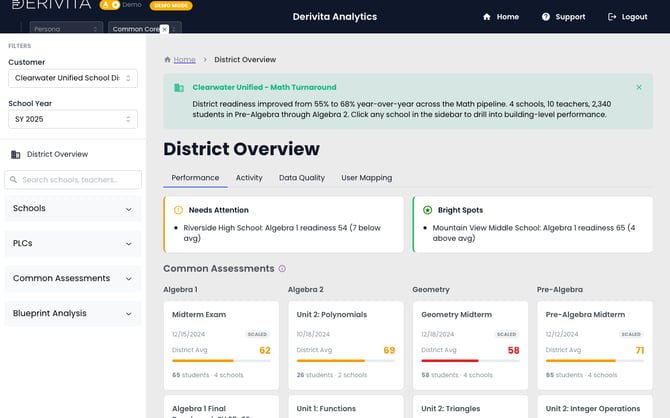 District Overview — Performance tab with Needs Attention / Bright Spots
Read it in 30 seconds
Start with the top line: district readiness. In this district it's 68%, up from 55% the prior year — a +13 point year-over-year gain.
Open a subject and each school shows two columns that, read together, are the whole point:
- Readiness — how ready that school's students are for the end-of-course exam.
- Coverage — how much of the blueprint has actually been taught yet.
A readiness number on its own isn't a decision. Reading it against coverage is what turns it into one:
| What you see | What it means | What to do |
|---|---|---|
| Readiness tracking near coverage, coverage still low | Pacing — students are learning; there's just more to teach | Keep teaching; don't panic |
| Coverage high but readiness well below it | Mastery — the material's been taught and not learned | Reteach specific standards |
| Both low | Support — students need intervention, on specific standards | Coach + intervene |
Worked example. Open the Algebra 1 row: readiness runs from 65 (Mountain View, +4) down to 54 (Riverside, −7 and gap-flagged), against a district average of 61. Coverage is similar across schools (51–59%), so the spread is mostly mastery, not a coverage artifact. Riverside is lowest on both readiness (54) and coverage (51%) — behind on teaching and mastery — so it's the support priority, not a wait-and-see.
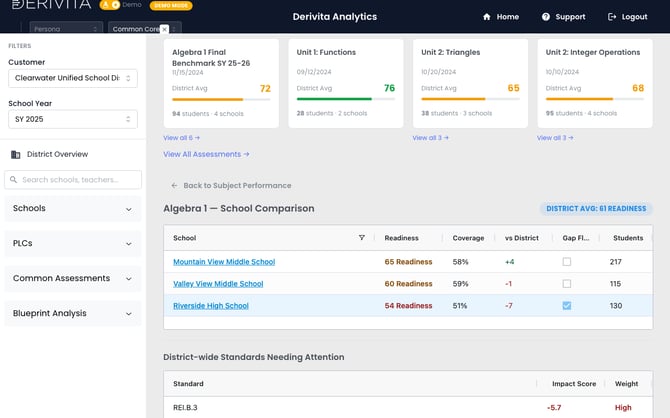 Algebra 1 school comparison — Mountain View 65 to Riverside 54
Only Algebra 1 has Readiness here — it's the blueprint (end-of-course) subject. Geometry, Algebra 2, and Pre-Algebra show Average Mastery (no blueprint); Math Foundations is practice-only. See why some subjects show Readiness vs Mastery.
The one move
Sort by readiness and look at the gap-flagged school at the bottom (Riverside here, 54). That's your support-and-coaching priority before the exam — a defensible focus you can name in a cabinet meeting, not a hunch. (For the full attainment-vs-coverage breakdown behind a readiness number, open the blueprint — see What is Blueprint Readiness?.)
▶ VIDEO
Related
- Concept: What is Blueprint Readiness? — why readiness = attainment × coverage
- Next: Which standards are dragging the district?
- Compare campuses head-to-head: Cross-school comparison