![derivita-logowhite (2).png]](https://support.derivita.com/hs-fs/hubfs/derivita-logowhite%20(2).png?height=25&name=derivita-logowhite%20(2).png)
For district admins and curriculum coordinators: the Comparison view inside a blueprint puts every school on the same end-of-course exam, so "which campus needs support first" stops being a hunch.
Get there- Open Blueprint Analysis and click the Algebra 1 blueprint.
- Scroll to Comparison and set the dropdown to School (you can also compare by Course).
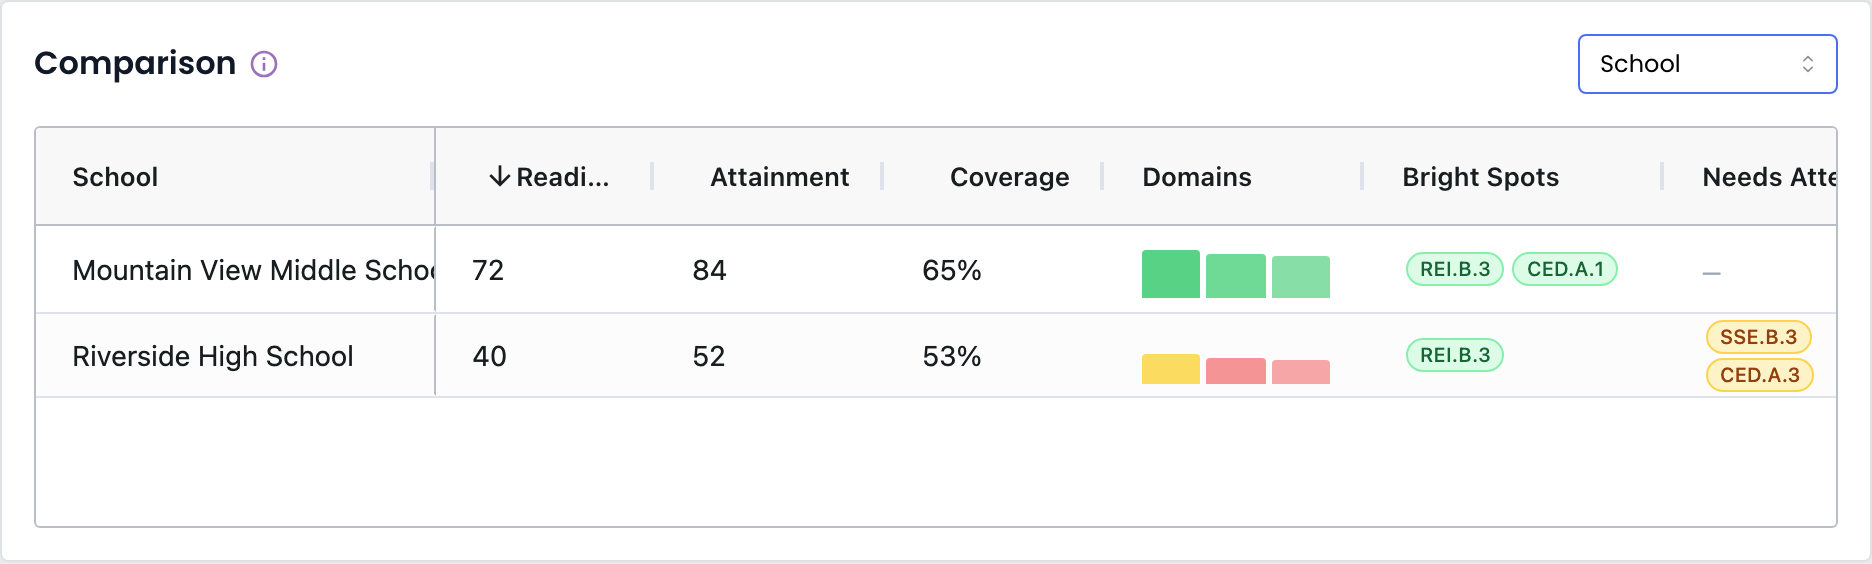 Blueprint Comparison by school — Mountain View vs Riverside on the Algebra 1 blueprint
Every school is measured against the same Algebra 1 blueprint, so the columns are directly comparable:
| School | Readiness | Attainment | Coverage | Needs Attention |
|---|---|---|---|---|
| Mountain View | 72 | 84 | 65% | — |
| Riverside | 40 | 52 | 53% | SSE.B.3, CED.A.3 |
That's a 32-point readiness gap on the same exam. Read it with the attainment/coverage split: Mountain View is high on both (a genuine bright spot); Riverside is low on both — behind on teaching and mastery, which is a support situation, not a pacing one. The Needs Attention chips name the exact standards dragging Riverside down (SSE.B.3, CED.A.3), and Bright Spots show what's already working.
Only Algebra 1 has a cross-school blueprint comparison — it's the end-of-course blueprint subject. See why some subjects show Readiness vs Mastery.The one move
Send support to the lowest-readiness campus first (Riverside, 40), and target its Needs Attention standards (SSE.B.3, CED.A.3) — a defensible, standard-level focus for coaching and PD, not "Riverside needs to do better."
▶ VIDEO
Related- District altitude: See where your district stands, by subject and school
- Concept: What is Blueprint Readiness?
- Reference: why some subjects show Readiness vs Mastery