![derivita-logowhite (2).png]](https://support.derivita.com/hs-fs/hubfs/derivita-logowhite%20(2).png?height=25&name=derivita-logowhite%20(2).png)
A reporting-quality release. Colors and drill-downs now mean the same thing on every screen, subgroup analysis reaches more views, and several numbers got more precise. There's nothing to relearn — the same views you know, now more consistent and trustworthy. A second release later in the month added more reporting detail and a student-privacy guarantee — see Also shipped later in August, below.
Last updated: August 2026
Consistent colors and legendsReadiness and mastery are visually distinct again. Readiness bars no longer borrow the mastery-tier colors, and they're capped at the coverage ceiling — so a strong class that simply hasn't been taught the whole blueprint yet no longer reads as "red." The Blueprint Breakdown, the Scores by Standard heatmap, and the Item Analysis heatmap now all read from one shared mastery-tier legend: the same color means the same thing everywhere.
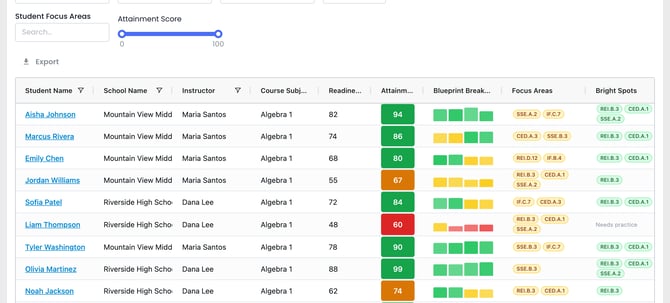
"Blueprint Students tab — Readiness shows as a plain, coverage-weighted number while Attainment carries the green/orange/red mastery bands"
Drill-downs match what you clickedClick a tier in Standards Analysis, a band on the Students tab, or a principal subject drill-in, and you now land on exactly the group you clicked — that tier or attainment band — instead of defaulting to Mastery. Teacher Performance drill-throughs now open the same standard and students shown in the insight boxes, so the page you land on reconciles with the box you clicked.
Deeper subgroup analysisThe demographic subgroup filter now applies across the remaining Blueprint reporting surfaces — standard mastery, standards impact, domain summary, assessment scores, performance change, school coverage, and the Students tab — so you can scope any of them to a specific group.
More precise numbers- PLC standards analysis counts distinct students in the mastery bar.
- District Blueprint Detail now respects the School filter in its overview.
- Score cells handle blank or partial values cleanly, with tooltips rounded to match what's shown.
- The student view loads faster — recent-assignment lookups no longer scan a full year of data.
- Question Replay fits its content with more of each answer choice visible, and the question preview is keyboard-scrollable.
- The School Year filter reads as a range (e.g. 2025-2026) instead of just the start year.
A second August release added reporting detail and a privacy guarantee:
- Blueprint context travels with the detail view. The blueprint's detail page now shows where its weights come from — a Claim-based weights or Coverage — not state-tested badge, the blueprint package it's based on, and a link to the published blueprint.
- The School Year picker only lists years with data. No more empty years in the dropdown — every option is one you can actually open.
- Unscored assignments read clearly. A student who didn't submit now shows a dedicated Not-submitted frame in the assessment replay, so "didn't turn it in" never looks like a low score.
- Sharper assignment filtering. On Common Assessments, the Assignment Name filter narrows to the Grade or Course you've selected; on the assignment view, the question now renders inline beside the distractor bars, so you read the item and the answer split together.
- Small groups stay private. Any group of 5 or fewer students is hidden across subgroup and PLC breakdowns to protect student privacy — those students still count in every total and average; only the small cell is masked. This safeguard now holds across every reporting surface.
These views were refreshed in this release — open any for the how-to:
- Find any student on the blueprint — Students tab (the Readiness/Attainment coloring above)
- Who needs help — every student in your class
- How is this student doing? — Blueprint Breakdown legend
- Compare assessments for the same cohort
- How did this assignment perform? — Item Analysis heatmap
- Is this a pacing gap or a teaching gap? — the blueprint detail's new coverage-type badge
- Which wrong answers are students clustering on? — the question now inline beside the distractor bars
- Walk this student's attempt, question by question — the Not-submitted frame
- Our assessment program at a glance — the Grade/Course-scoped Assignment Name filter
- What is Blueprint Readiness? — why readiness, attainment, and coverage are three different numbers
- Browse every release on the What's New page (this article's category landing).