![derivita-logowhite (2).png]](https://support.derivita.com/hs-fs/hubfs/derivita-logowhite%20(2).png?height=25&name=derivita-logowhite%20(2).png)
For teachers: the Student profile is one student across every standard — where they're strong, the two or three areas to support next, and how their mastery has moved over time.
Get there- Click any student's name — from your Students tab, a course roster, or an assignment's answers.
- You land on the student's profile.
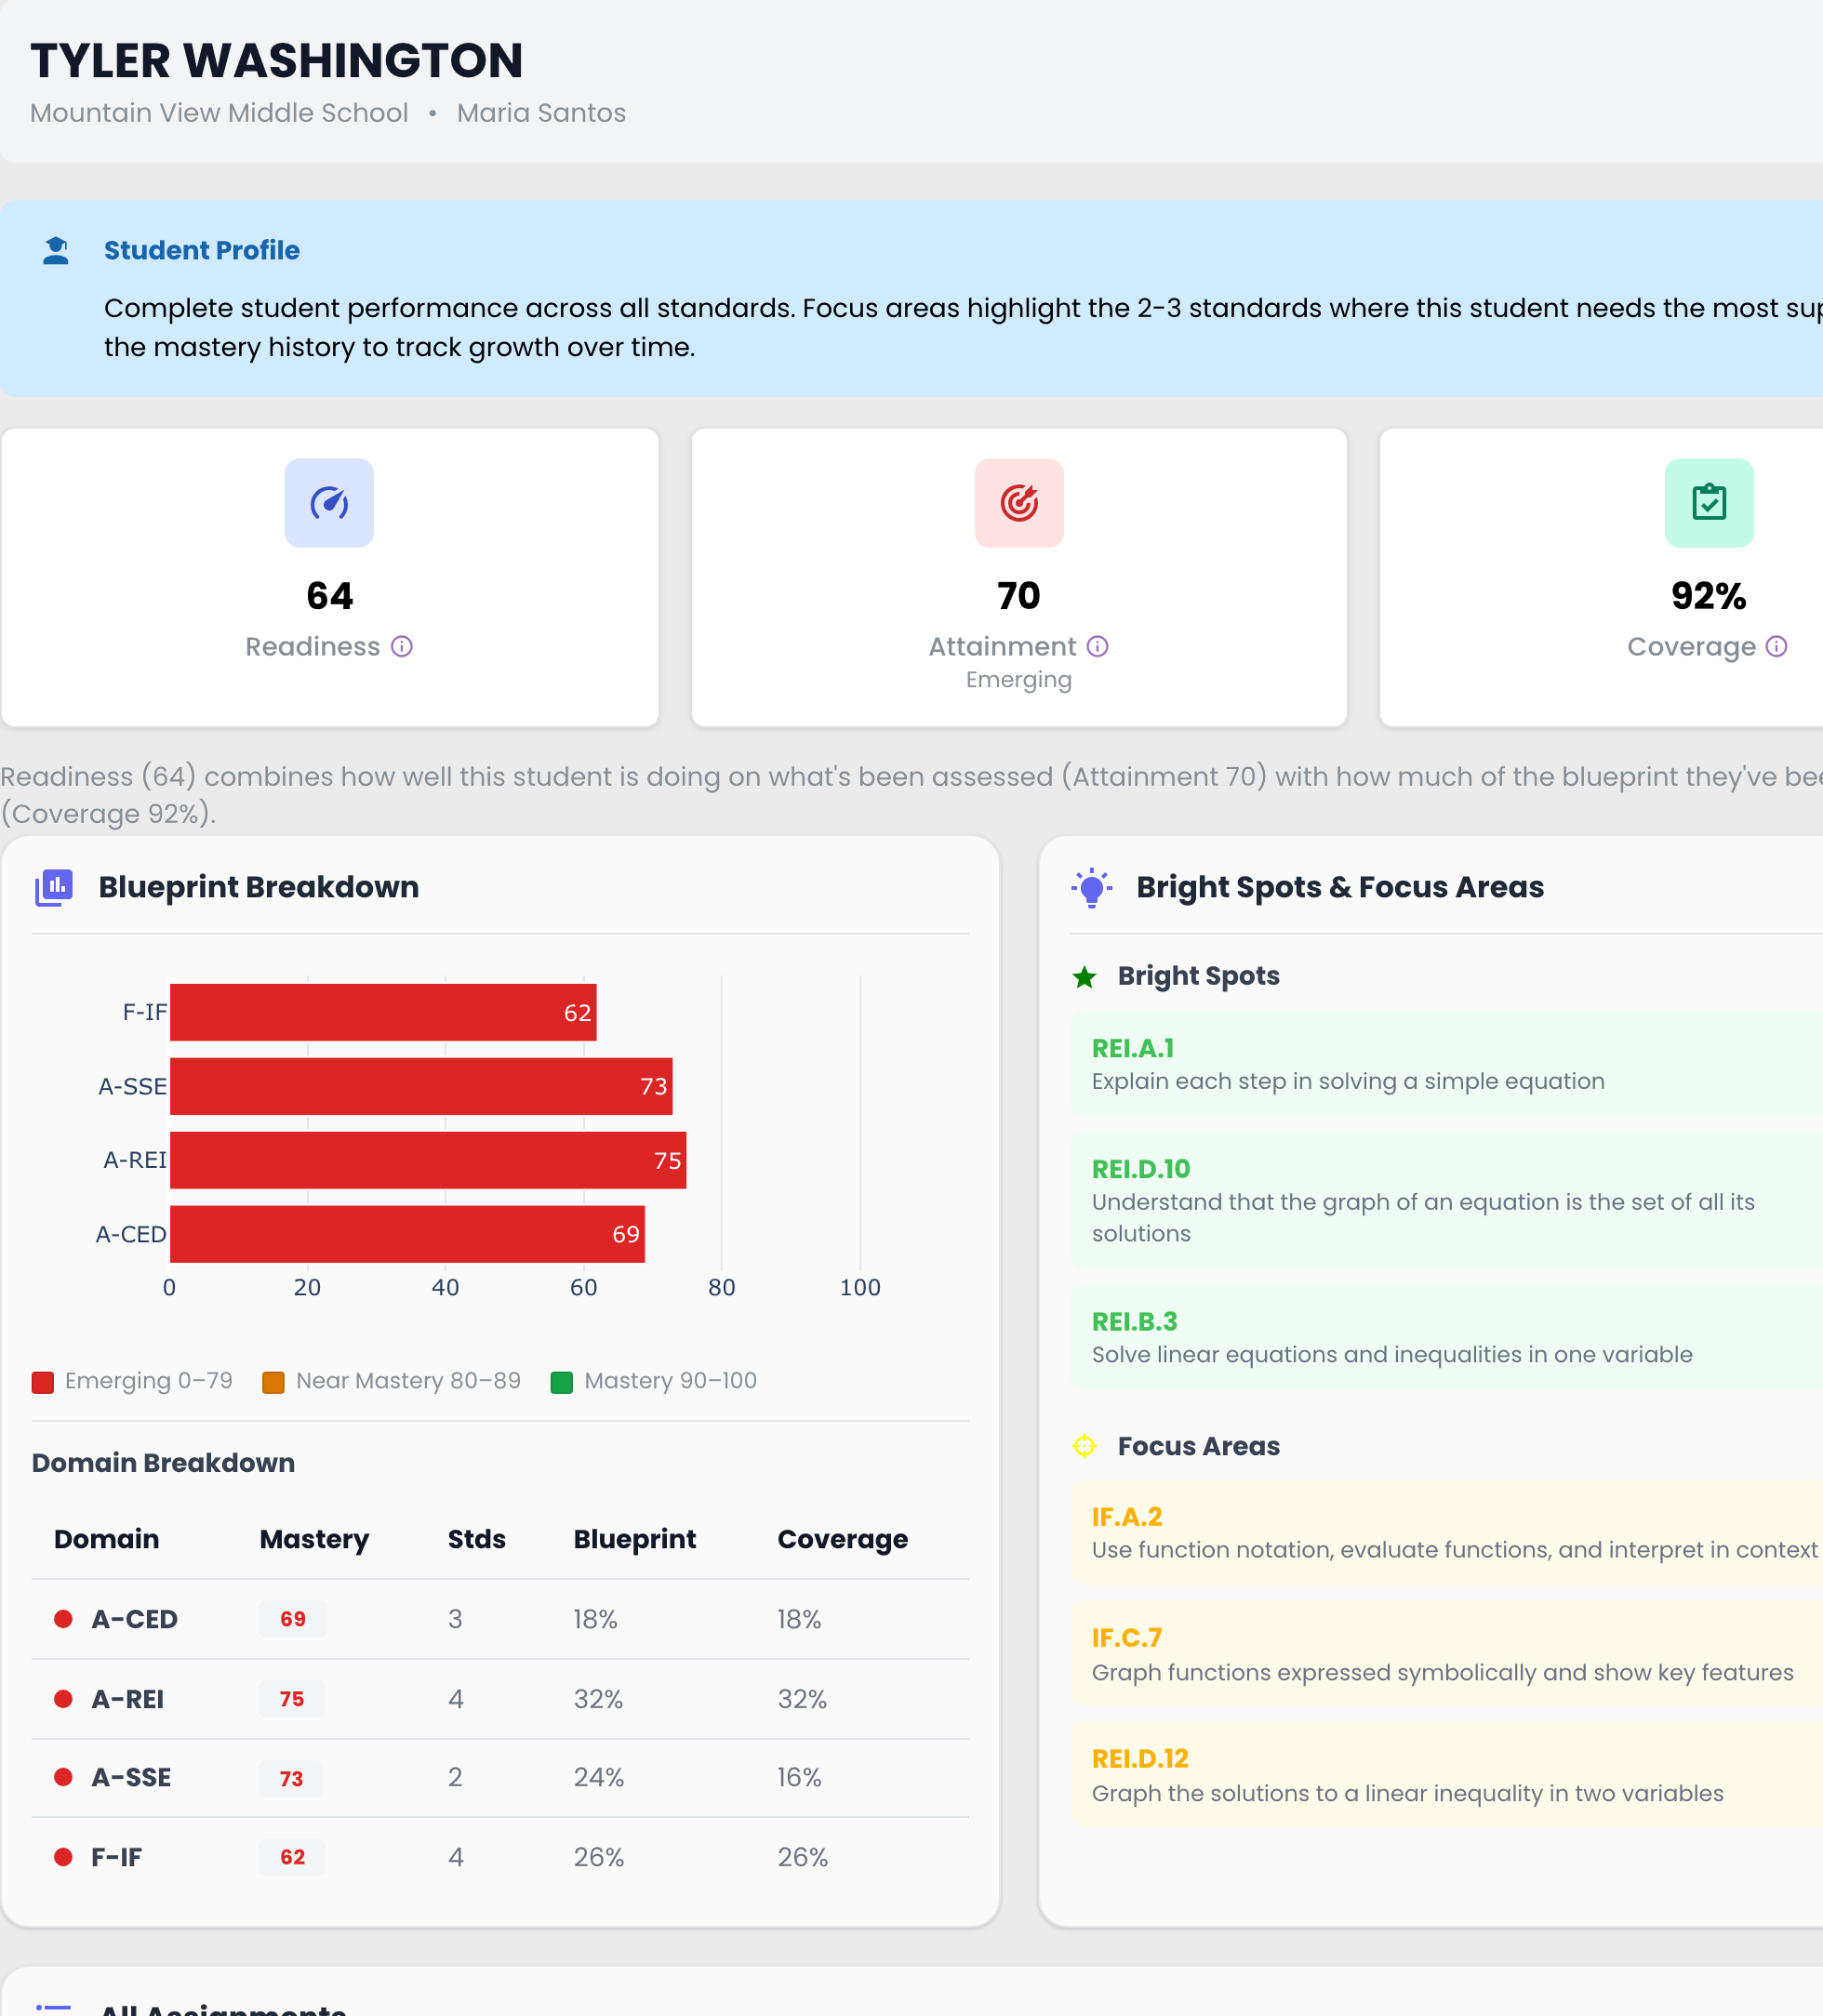
- The three numbers up top — Readiness 64, Attainment 70 (how well they've mastered what's been taught), Coverage 92% (how much of the blueprint they've been tested on). Readiness combines the two, so you can see why the number is what it is.
- Blueprint Breakdown — mastery by domain (A-REI 75, A-SSE 73, A-CED 69, F-IF 62), with a Domain Breakdown table showing how much of each domain's blueprint has been covered.
- Bright Spots & Focus Areas — one card, two lists. Focus Areas names the 2-3 standards this student needs most — IF.A.2 (48), IF.C.7 (52), REI.D.12 (55) — the highest-leverage place for your one-on-one time. Bright Spots names what they've mastered — REI.A.1 (84), REI.D.10 (82), REI.B.3 (80) — useful for peer pairing.
Work the Focus Areas — they're already the highest-leverage 2-3 standards for this student, not a wall of data. Pair a bright spot with a nearby struggling student if you're grouping.
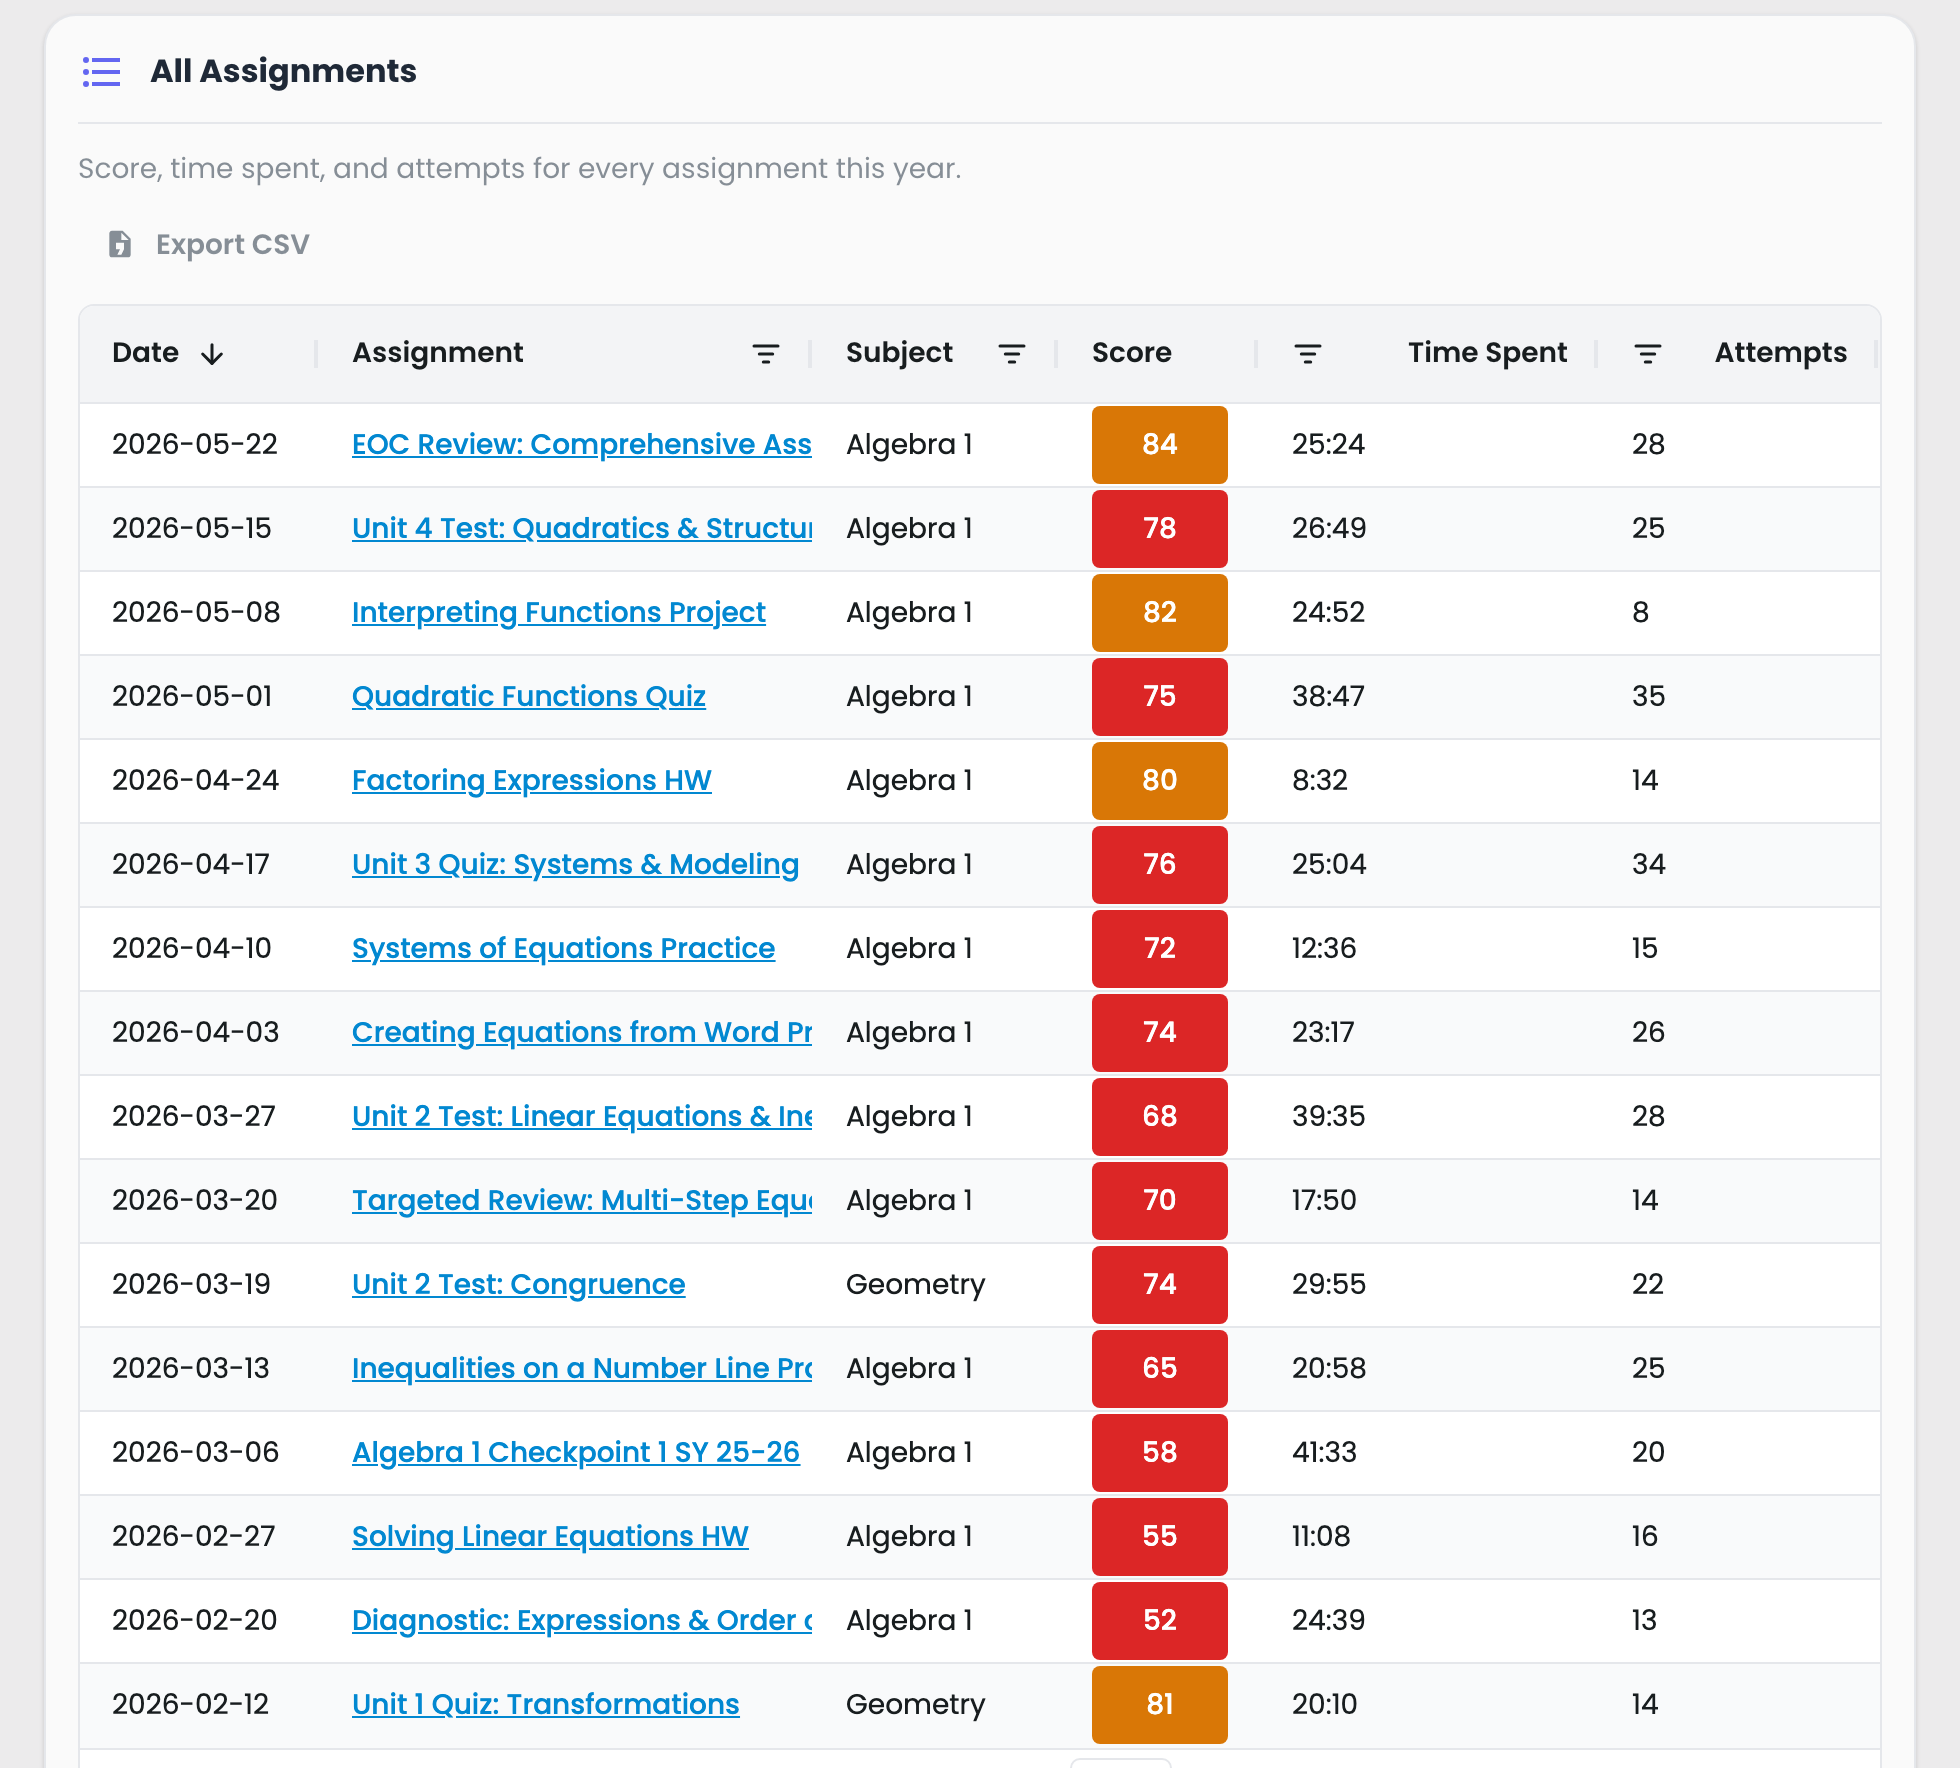
Every assignment, with time and attemptsBelow the summary, All Assignments lists every assignment this student has submitted this year — Score, Time Spent, and Attempts side by side in one sortable grid — so you don't have to open each assignment to piece it together. A long time on a low score (Algebra 1 Checkpoint 1: 58 in 41:33) reads differently from a quick low score: one student is working hard and stuck, the other may be rushing. Export CSV to bring it to a conference.
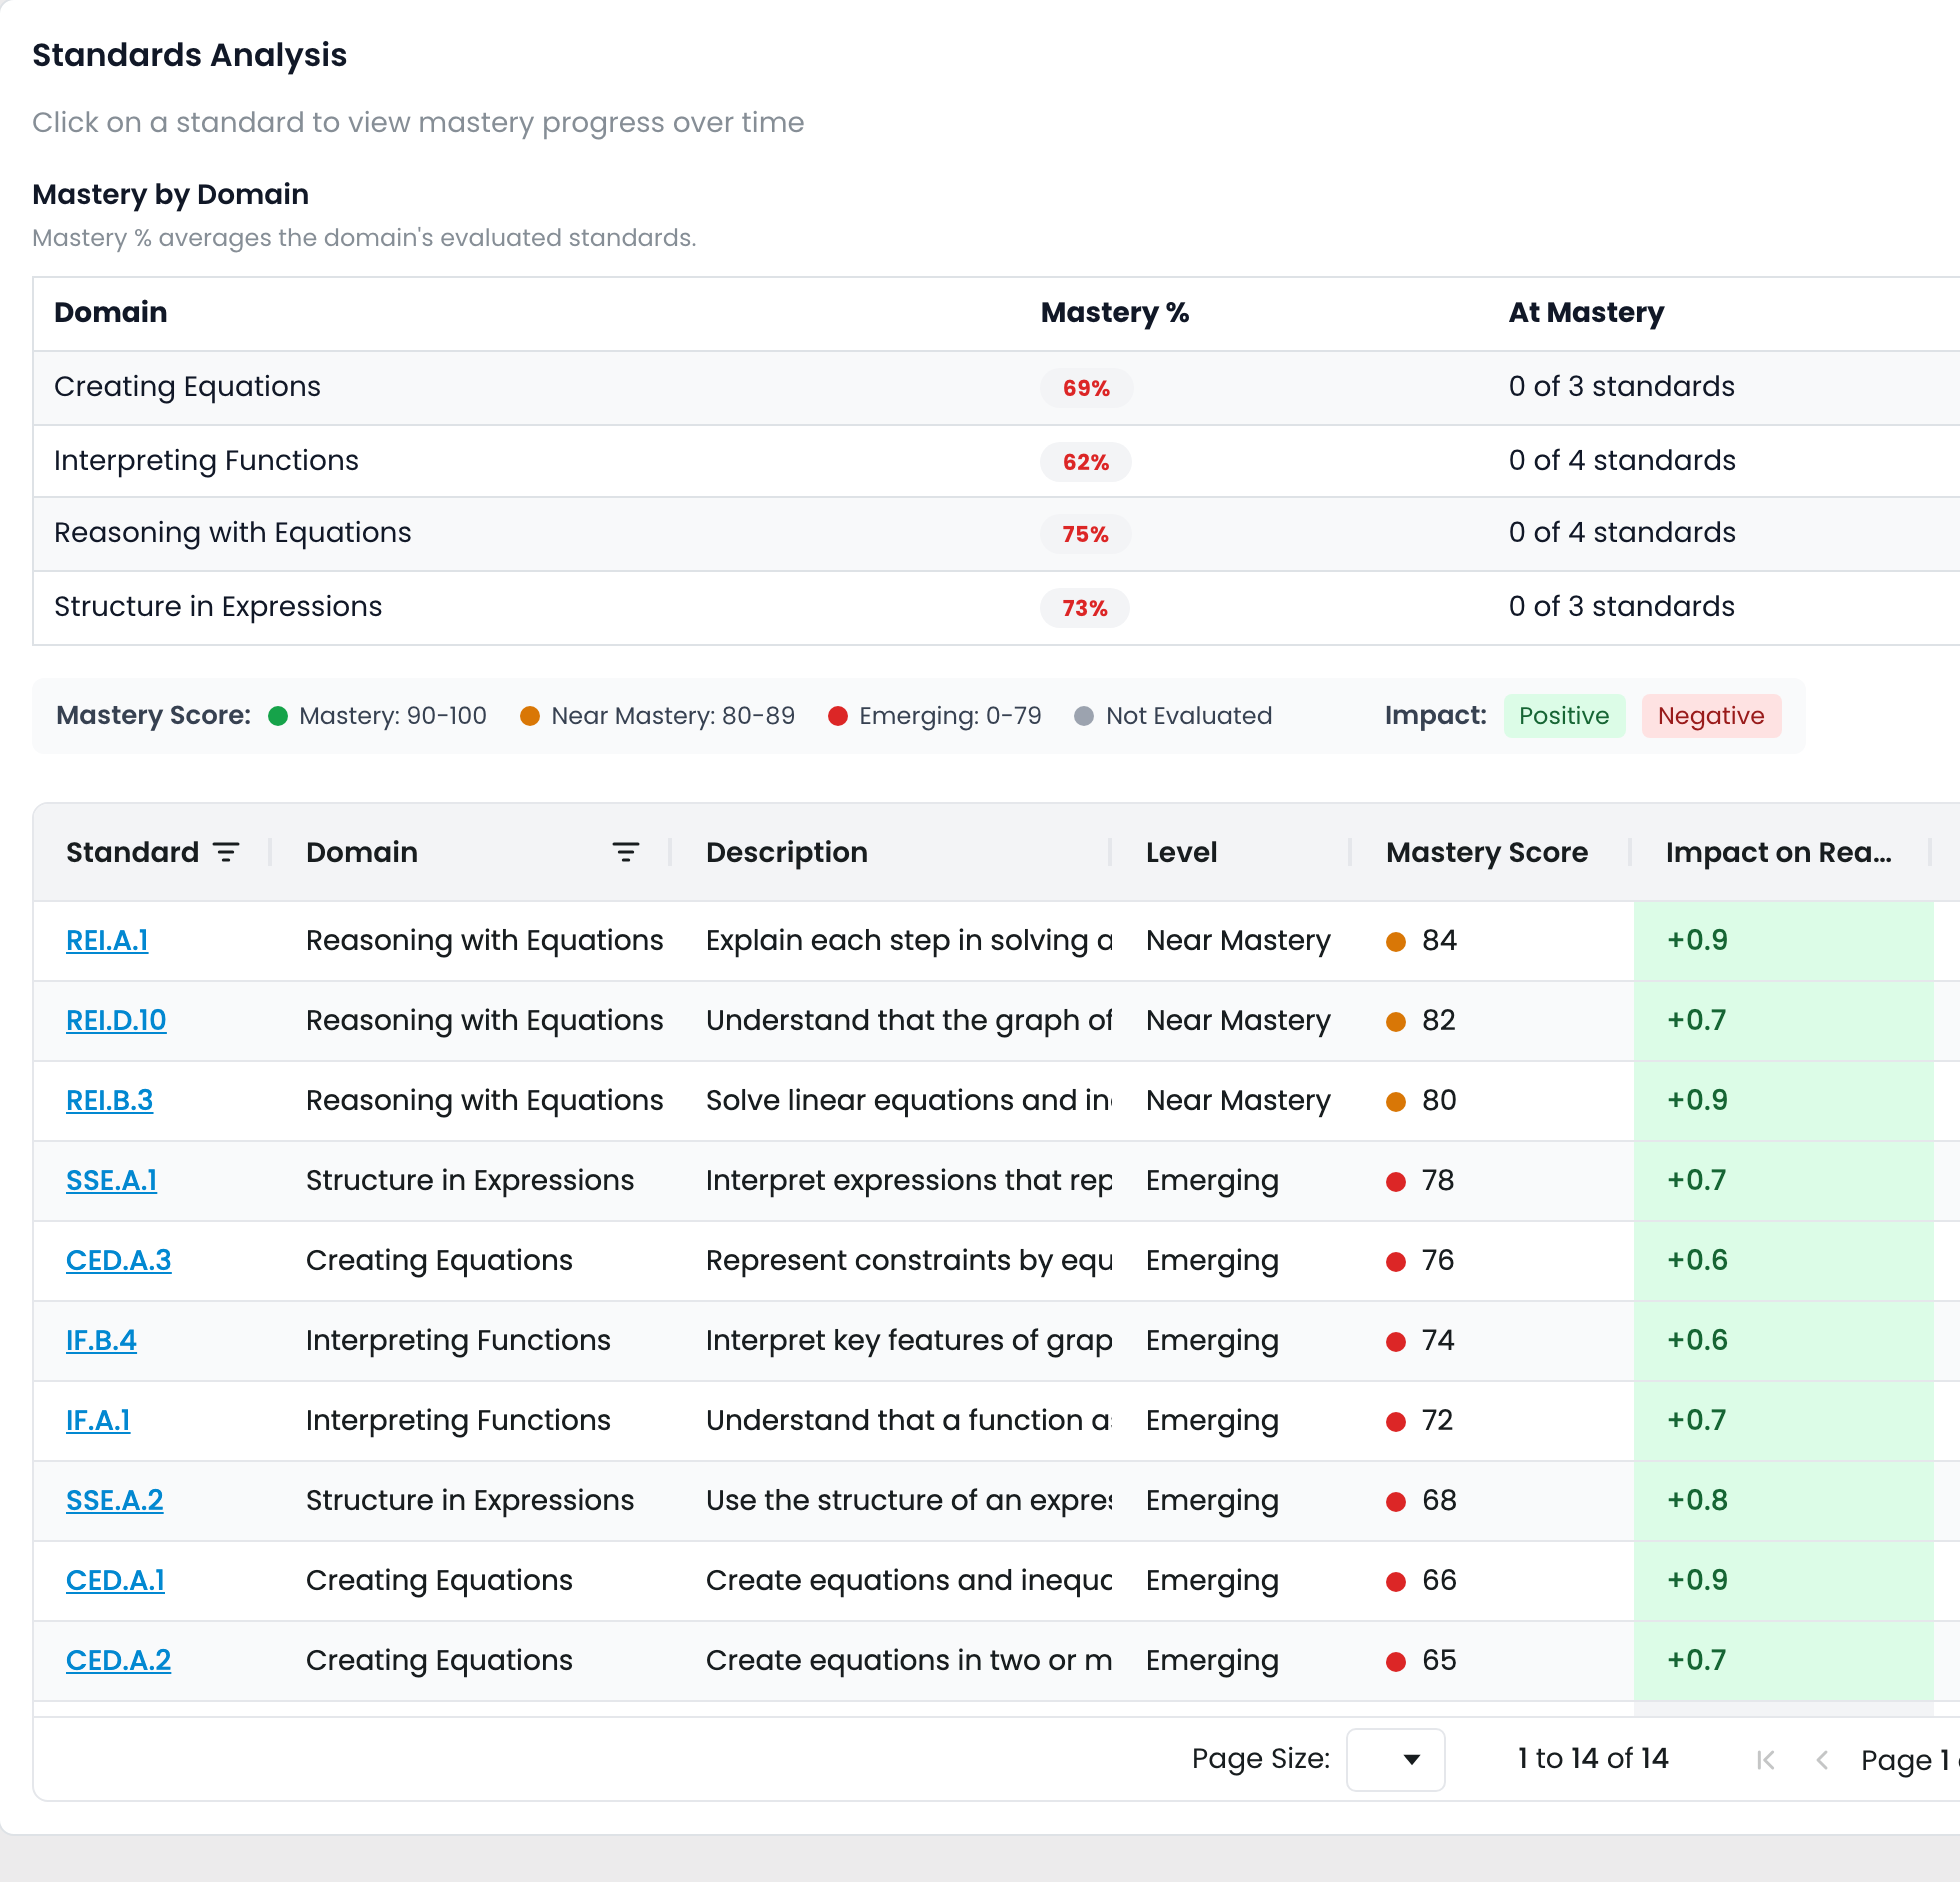
Below the summary, Standards Analysis opens with Mastery by Domain — each domain's overall Mastery % (the average of its assessed standards) and how many of its standards are At Mastery — the domain-level read standards-based grading needs. Under it, the grid lists every standard this student has touched, with its Domain, Level, Mastery Score, Impact on Readiness (how much moving that one standard would move their readiness number), and a Progress arrow. Sort or filter it, or Export it to plan from.
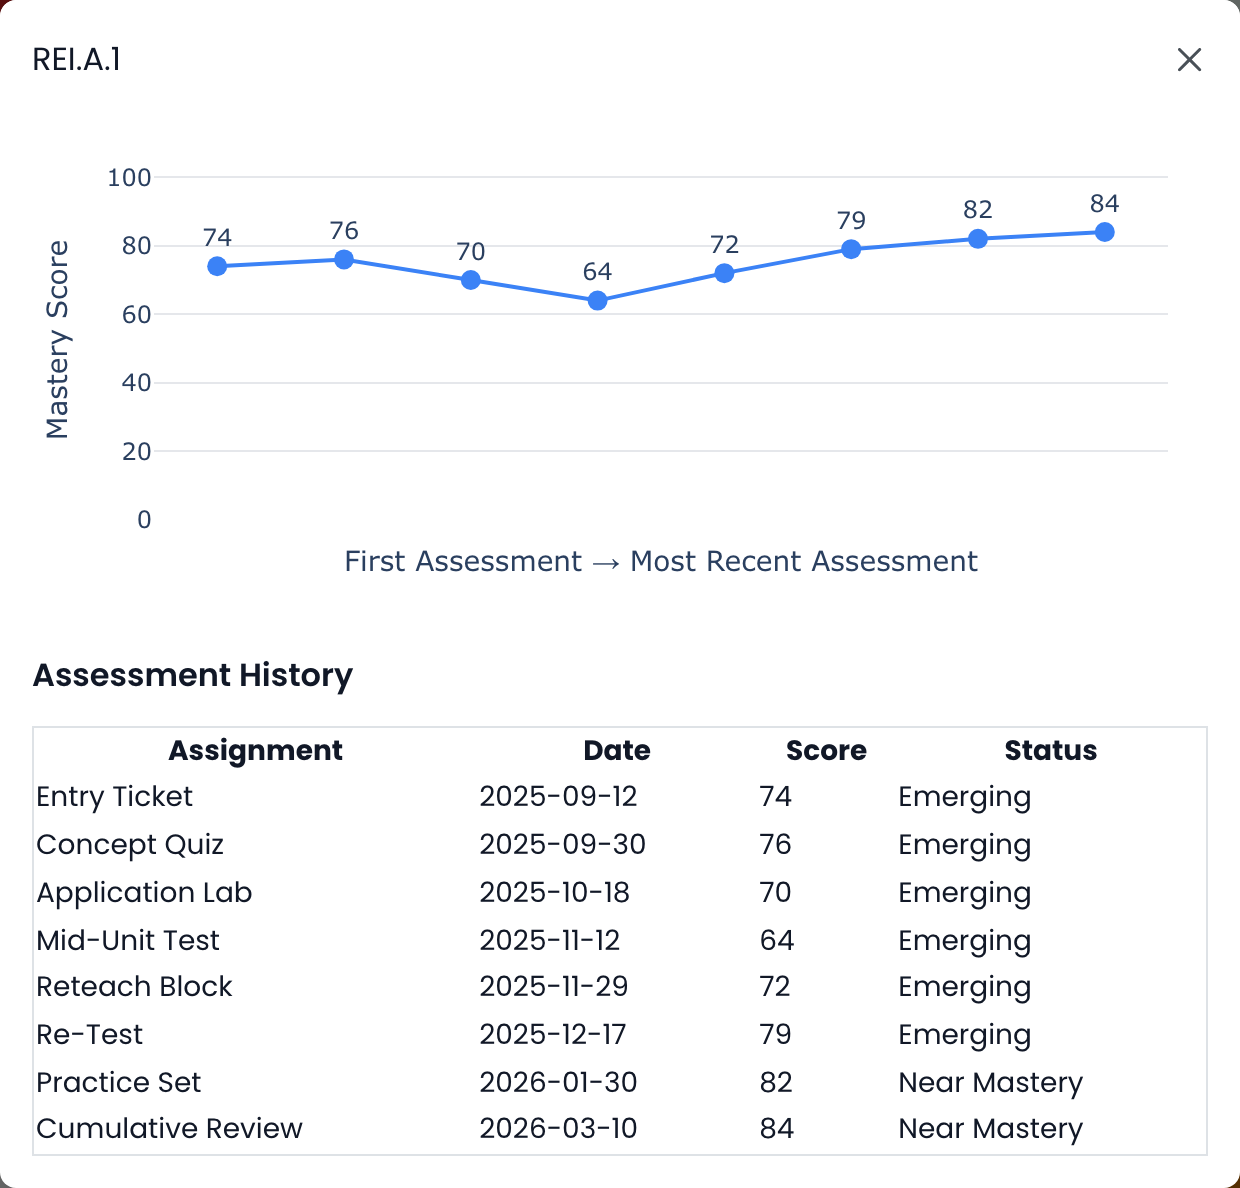
Click any standard — in this table or in a Bright Spots / Focus Areas callout — to open its mastery history over time: a line from first assessment to most recent, plus every assignment that touched the standard with its date, score, and outcome. This is where you see whether a reteach landed. Here, REI.A.1 dipped to Emerging (64) at the Mid-Unit Test, then a Reteach Block and Re-Test turned it around, climbing to Near Mastery (84) by the Cumulative Review.
The student profile adapts to the subject's type — the Readiness header only appears when there's an end-of-course blueprint to be ready for. (See Readiness vs. Mastery for why.)
- Blueprint subjects (Algebra 1, above) — the three numbers up top (Readiness · Attainment · Coverage) plus the Blueprint Breakdown.
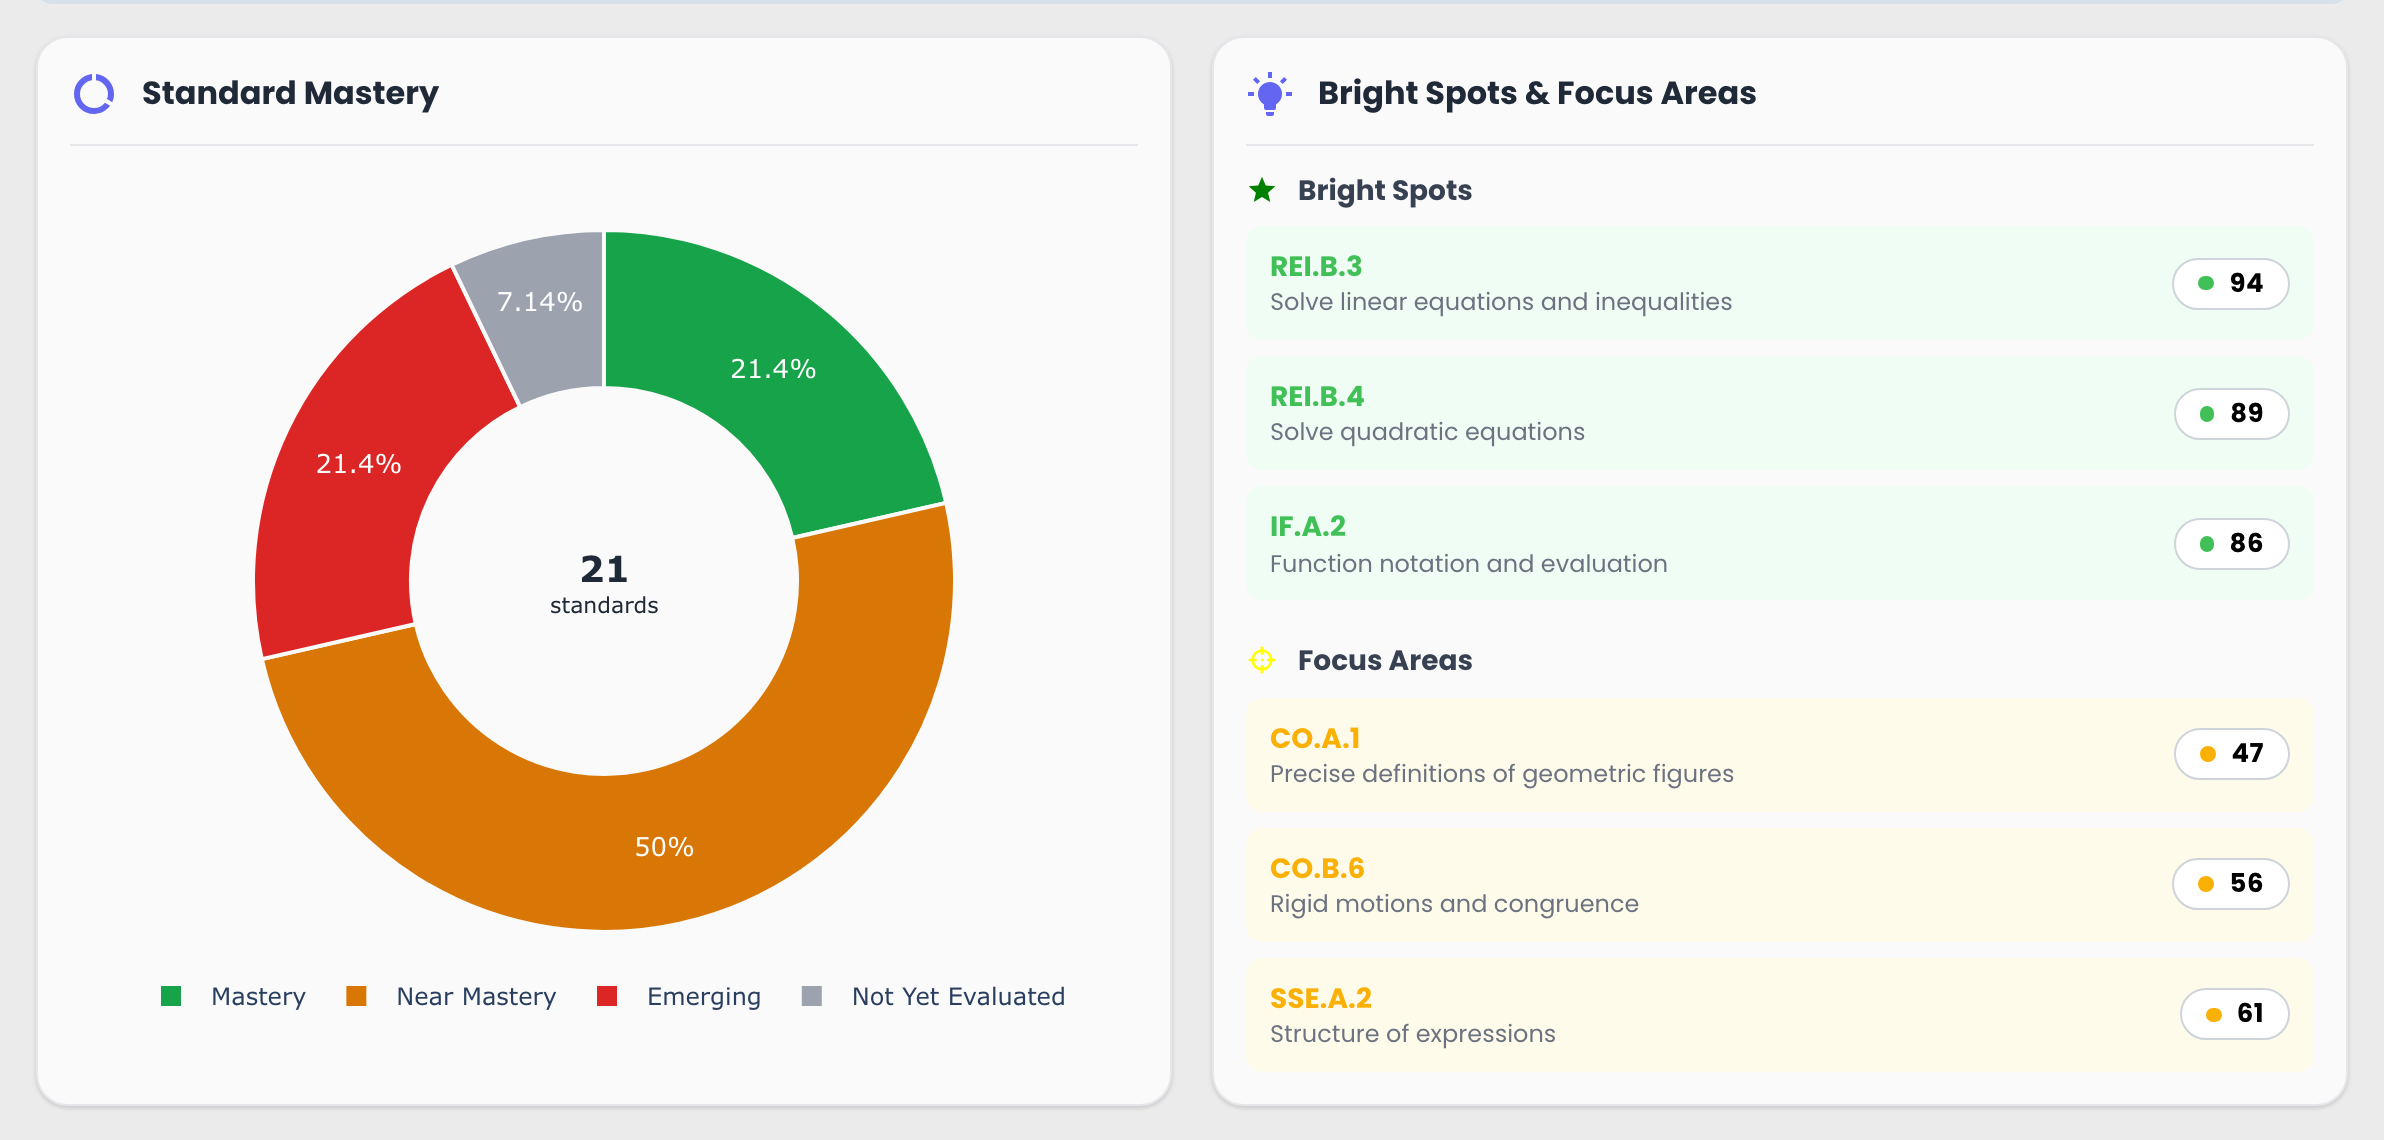
- Non-blueprint subjects — no Readiness header. Instead you get a Standard Mastery donut and the same Bright Spots & Focus Areas, framed as mastery rather than exam-readiness. Standards Analysis still lists every standard.
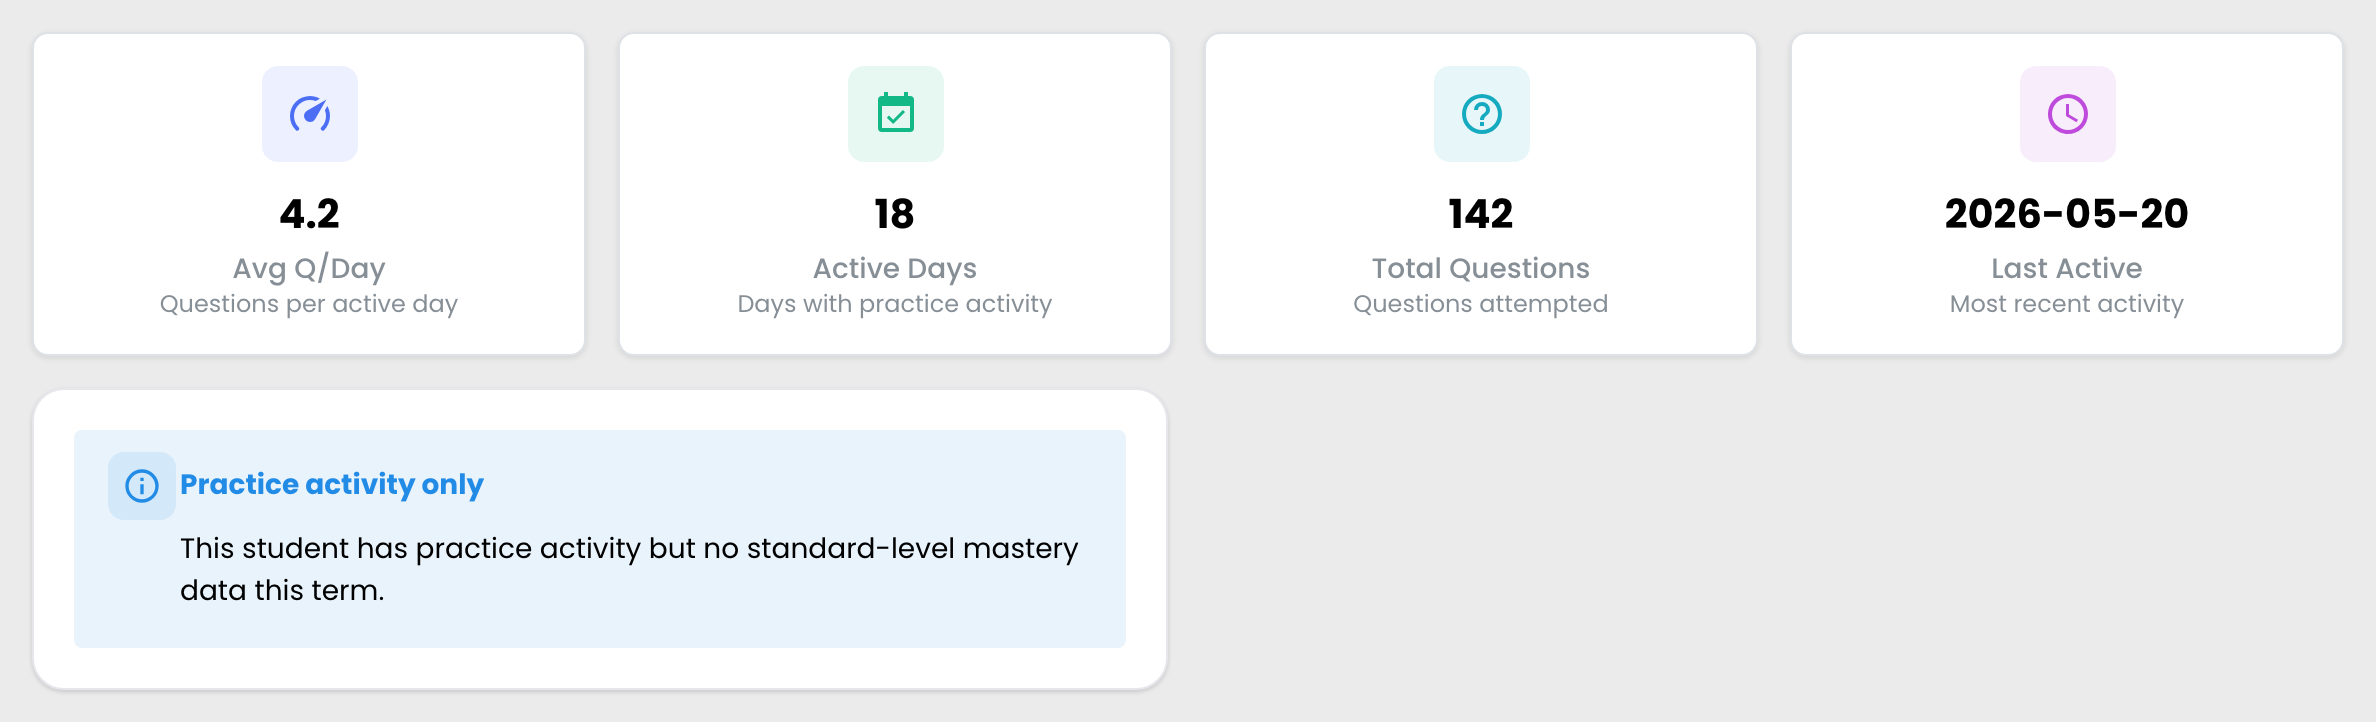
- Practice / homework-only courses — no assessment mastery to report, so Bright Spots and Focus Areas drop away entirely. The profile leans on activity instead — Avg Q/Day, Active Days, Total Questions, Last Active.
- Who needs help across the class: Your Students tab
- Drill in: How is this standard doing?
- Reference: why some subjects show Readiness vs Mastery