![derivita-logowhite (2).png]](https://support.derivita.com/hs-fs/hubfs/derivita-logowhite%20(2).png?height=25&name=derivita-logowhite%20(2).png)
For teachers: the Students tab is your whole roster on one screen — every student's readiness, what they've mastered, and the exact standards each one is stuck on. Sort it once and who to pull is obvious.
_Last updated: August 2026_
Get there
- Open your teacher dashboard and click the Students tab.
- It opens on your blueprint class (here, Algebra 1) — 28 students, with 0 at risk · 1 inactive flagged up top.
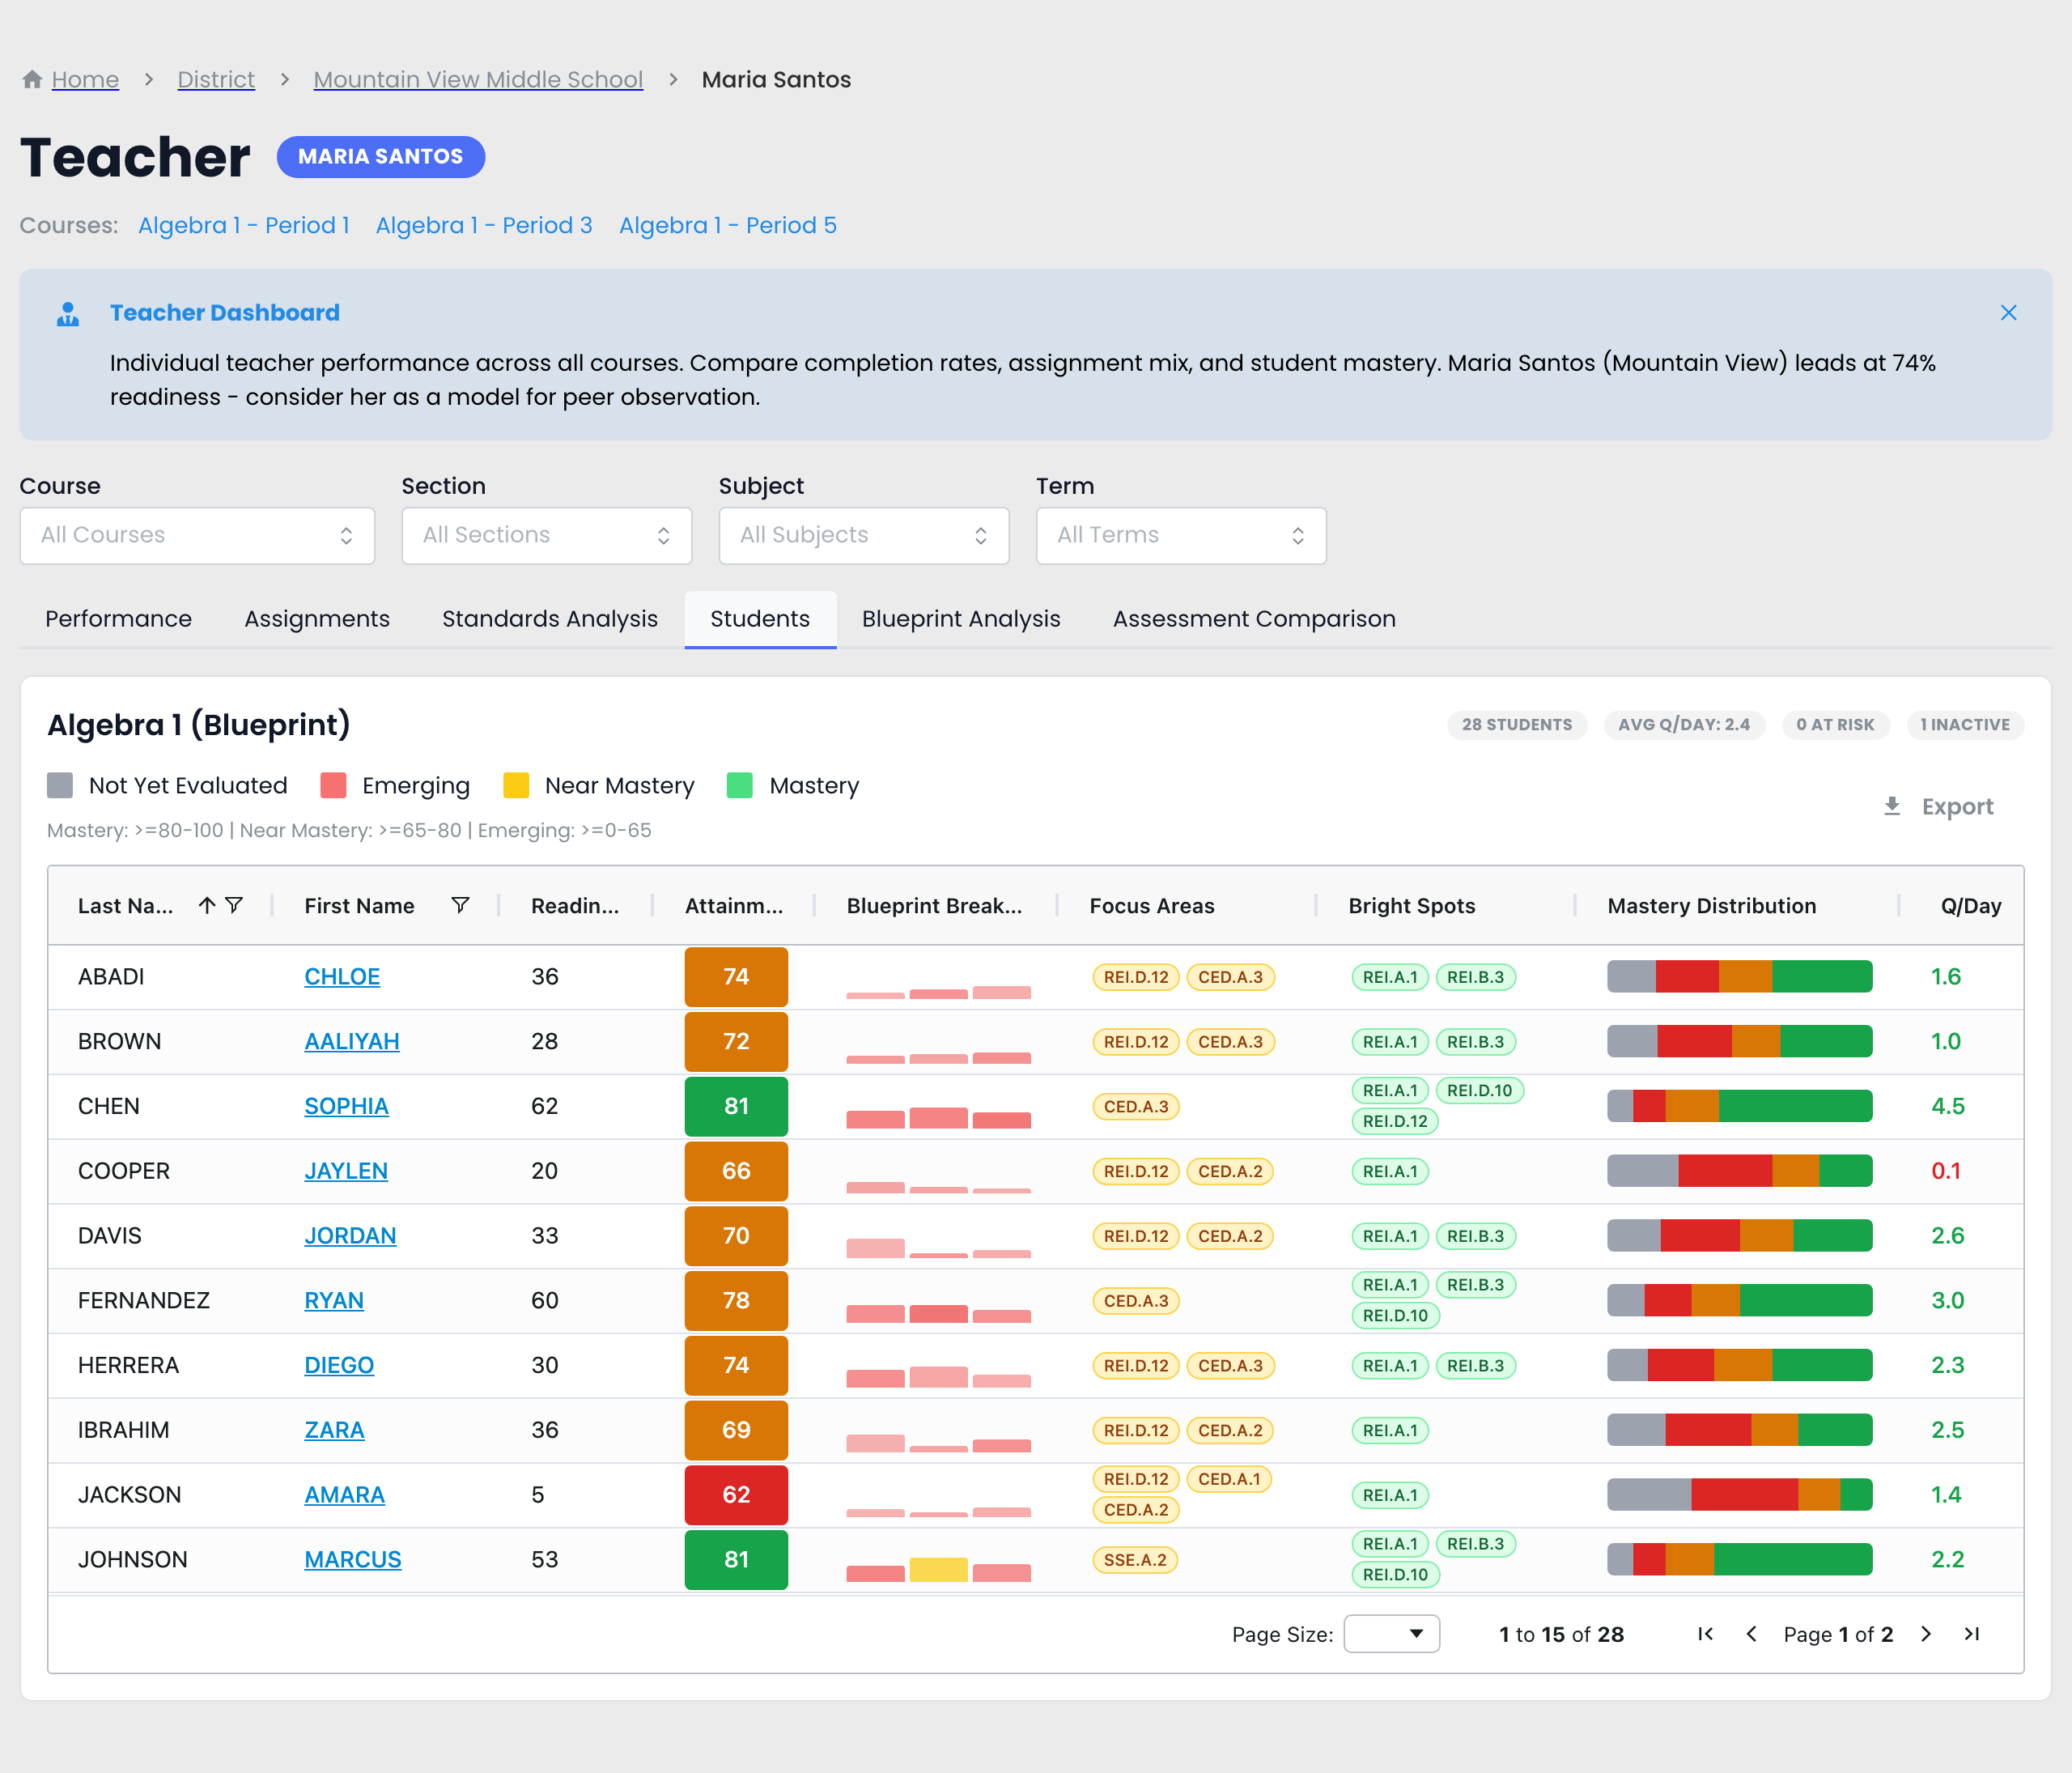 Students tab — readiness, attainment, focus areas, and bright spots per student
Read it in 30 seconds
Each row is one of your students, and the columns turn the roster into a plan:
- Readiness / Attainment — where they are on the end-of-course exam, and how much of what's been taught they've mastered.
- Blueprint Breakdown — a per-domain mastery strip, red-to-green.
- Focus Areas — the exact standards that student is emerging on (e.g. Amara Jackson: REI.D.12, CED.A.1, CED.A.2) — their reteach list.
- Bright Spots — the standards they've mastered (e.g. Sophia Chen: REI.A.1, REI.B.3, REI.D.10) — what to build on.
Click the Last Name header to sort, or the readiness column to bring the students furthest behind to the top — Amara Jackson (5) and Jaylen Cooper (20) here — while Sophia Chen (readiness 62, but 81 attainment, green) shows a student who's mastered what's been taught and just needs more of the blueprint covered.
The one move
Sort by readiness to bring the students furthest behind to the top, then scan the Attainment column — the red cells are the students who haven't mastered what's been taught, your reteach group. (A student low on readiness but green on attainment, like Sophia Chen, has just had less of the blueprint covered — that's pacing, not a reteach.) Read their Focus Areas — students who share a standard are your small group for it, already named. Export the list to plan from, and check on the inactive student before a low score makes it urgent.
This view is your own students only, framed for support — not an evaluation tool.
What changes by subject type
The Students table adapts to what a subject actually measures, so which columns you see depends on the subject type, not the specific course. There are three, and each gets a different view. (See Readiness vs. Mastery for why the platform measures them differently.)
- Blueprint subjects — a subject with an end-of-course blueprint gets the full readiness view: Readiness · Attainment · Blueprint Breakdown · Focus Areas · Bright Spots, under a heading marked "(Blueprint)." This is the only type that reports readiness, because it's the only one with a blueprint to measure against. (Algebra 1 in the example above.)
- Non-blueprint subjects — without a blueprint, Readiness, Attainment, and the Blueprint Breakdown drop away. You still get a Mastery Distribution plus Focus Areas / Bright Spots, so who's stuck on which standard is just as clear — it's framed as mastery, not readiness. (e.g. Geometry, Algebra 2, Pre-Algebra.)
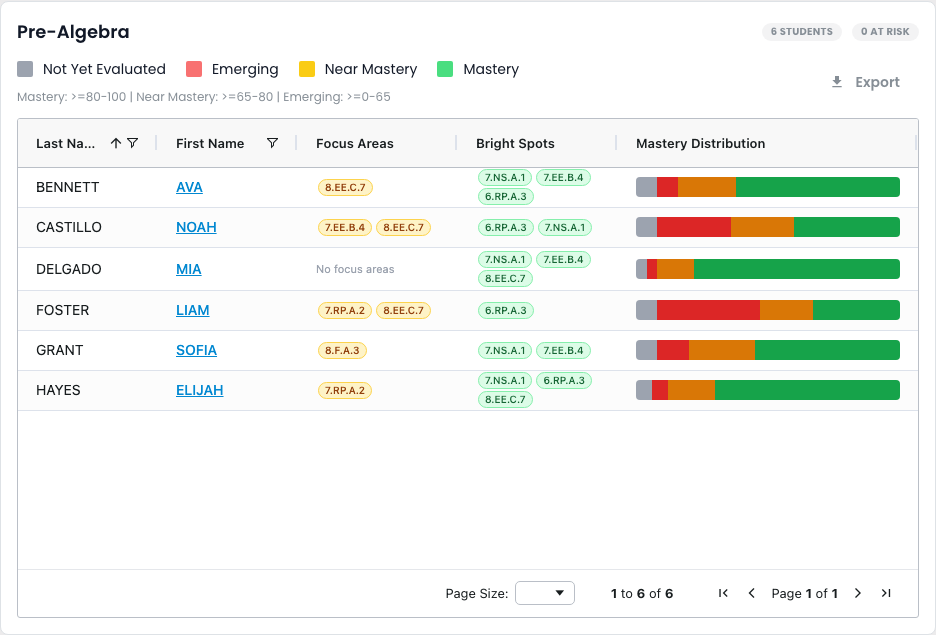 Non-blueprint subject Students view — Focus Areas, Bright Spots, and Mastery Distribution, no Readiness
- Homework-only courses — a practice course with no standards-aligned assessments has no mastery to report, so Focus Areas and Bright Spots drop away entirely. The table leans on activity instead — Q/Day, Last Active, Active Days — to show who's actually putting in reps. (e.g. a practice or Math Foundations course.)
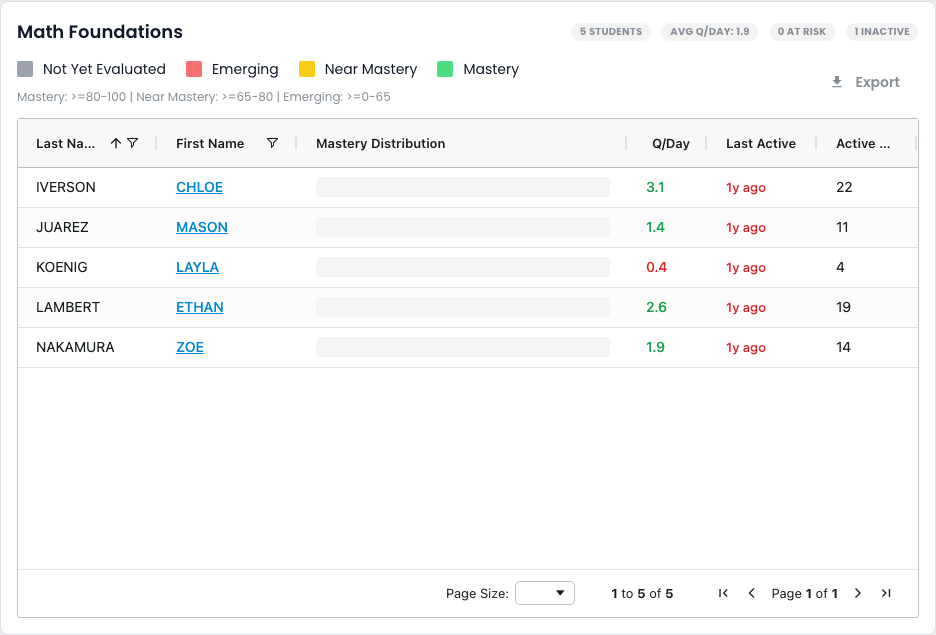 Homework-only course Students view — activity columns Q/Day, Last Active, and Active Days
▶ VIDEO
-
Related- Start here: What to do Monday — your reteach list
- Drill into a standard: How is this standard doing
- Reference: why some subjects show Readiness vs Mastery