![derivita-logowhite (2).png]](https://support.derivita.com/hs-fs/hubfs/derivita-logowhite%20(2).png?height=25&name=derivita-logowhite%20(2).png)
For coordinators and coaches: a readiness number is a snapshot. Student Performance Change by Standard shows the direction — the share of students improving vs. declining on each blueprint standard, so you can see where instruction is landing and where the cohort is quietly losing ground.
Get there- Open the Algebra 1 EOC blueprint.
- Scroll to Student Performance Change by Standard.
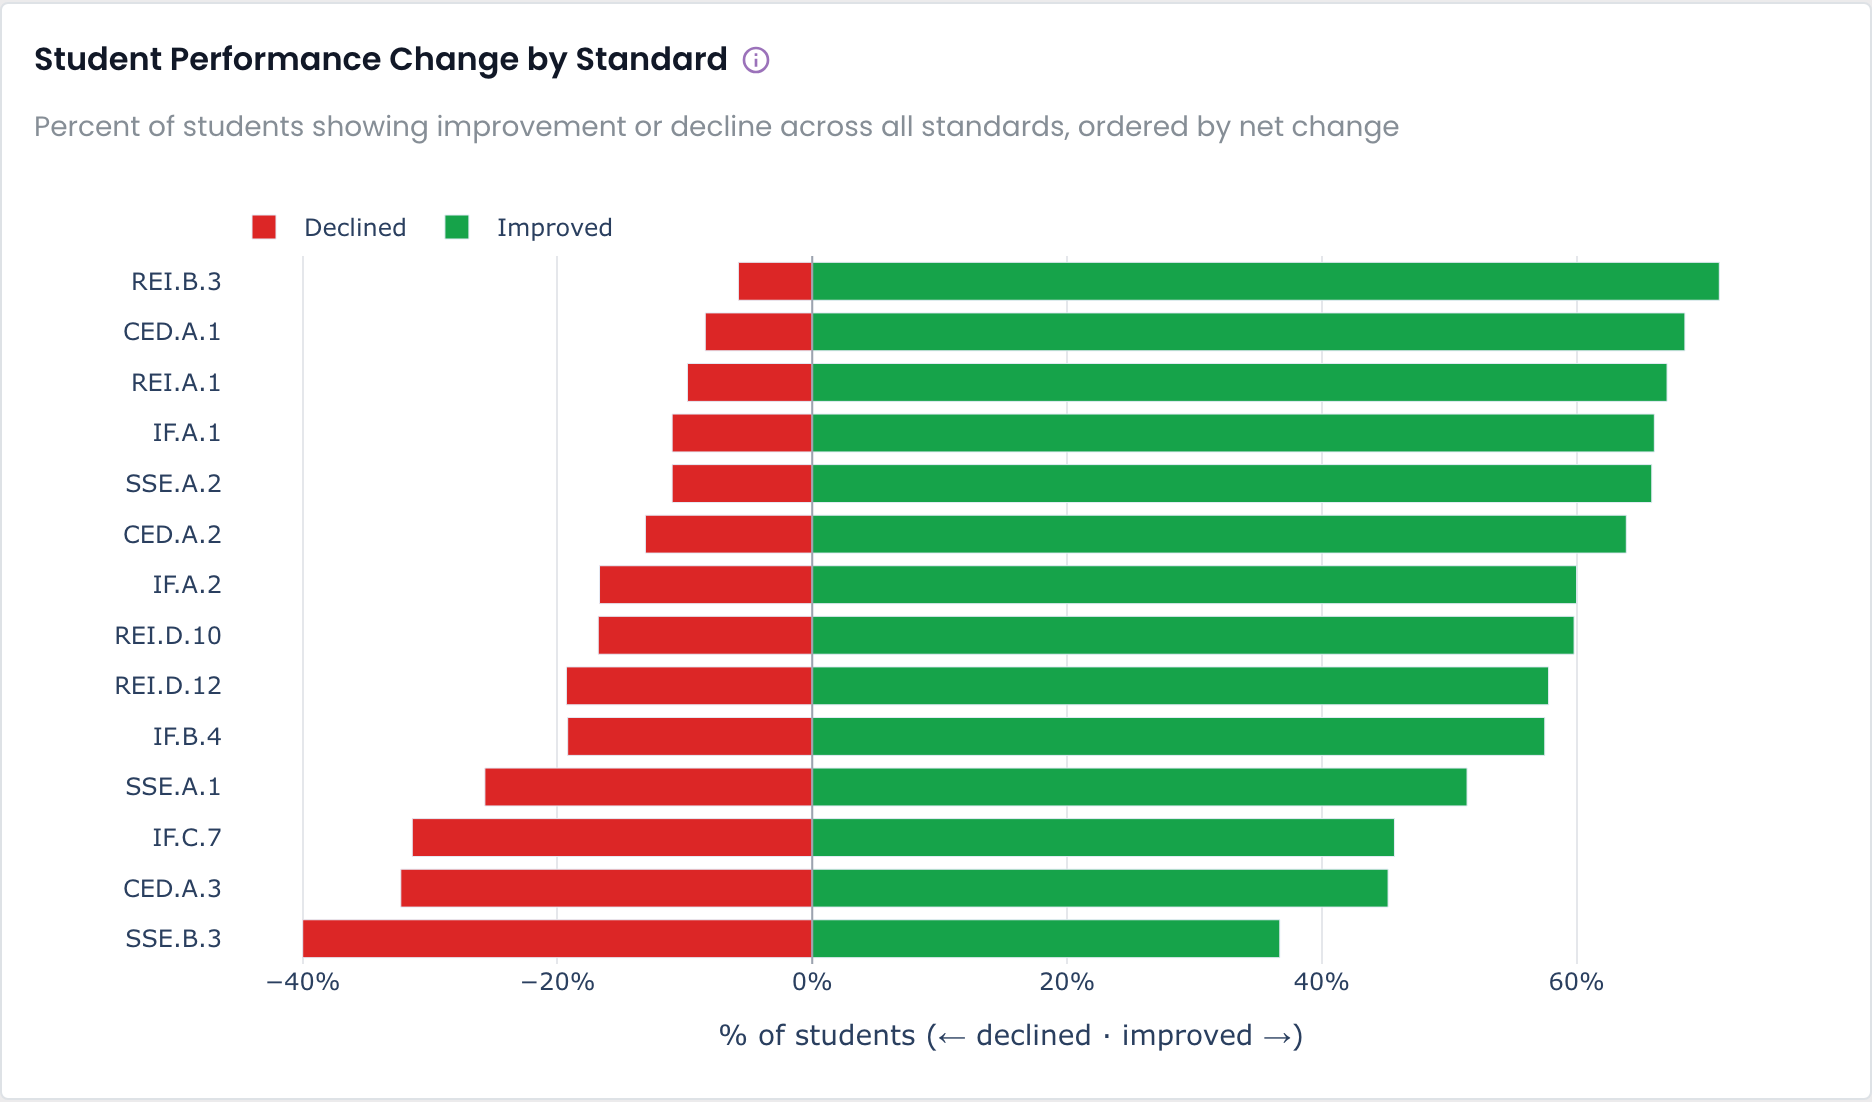 Student Performance Change by Standard — a diverging bar per standard, declined (red) vs improved (green), ordered by net change
- Each standard is a diverging bar — improved (green, right) against declined (red, left) — and the list is ordered by net change, best at the top.
- REI.B.3 leads: roughly 70% of students improved against only a small decline — the payoff of a targeted intervention this year (it's also the blueprint's biggest bright spot).
- SSE.B.3 is at the bottom: about 40% of students declined, the widest red bar on the board — the same standard already flagged as dragging down readiness. When a standard is both low and losing ground, it's the urgent one.
- The middle of the list is the healthy majority — mostly green with a normal amount of churn.
Read the two ends. The top is your proof-of-what-works — find out what moved REI.B.3 and copy it. The bottom is your alarm — a standard with a fat red bar is sliding now, before the end-of-course exam, so intervene there first rather than waiting for the next benchmark to confirm it.
▶ VIDEO
Related- Pacing vs teaching: Is this a pacing gap or a teaching gap?
- Drill into one: How is this standard doing?
- Across campuses: Which campus needs support first?