![derivita-logowhite (2).png]](https://support.derivita.com/hs-fs/hubfs/derivita-logowhite%20(2).png?height=25&name=derivita-logowhite%20(2).png)
For teachers and assessment leads: the Assignment view takes one assessment apart — the score spread, which items misbehaved, how each student answered, and how sections or subgroups compare.
Get there- Click an assessment name anywhere it appears — a course's Assignments tab, or Common Assessments in the sidebar.
- You land on the Overview tab.
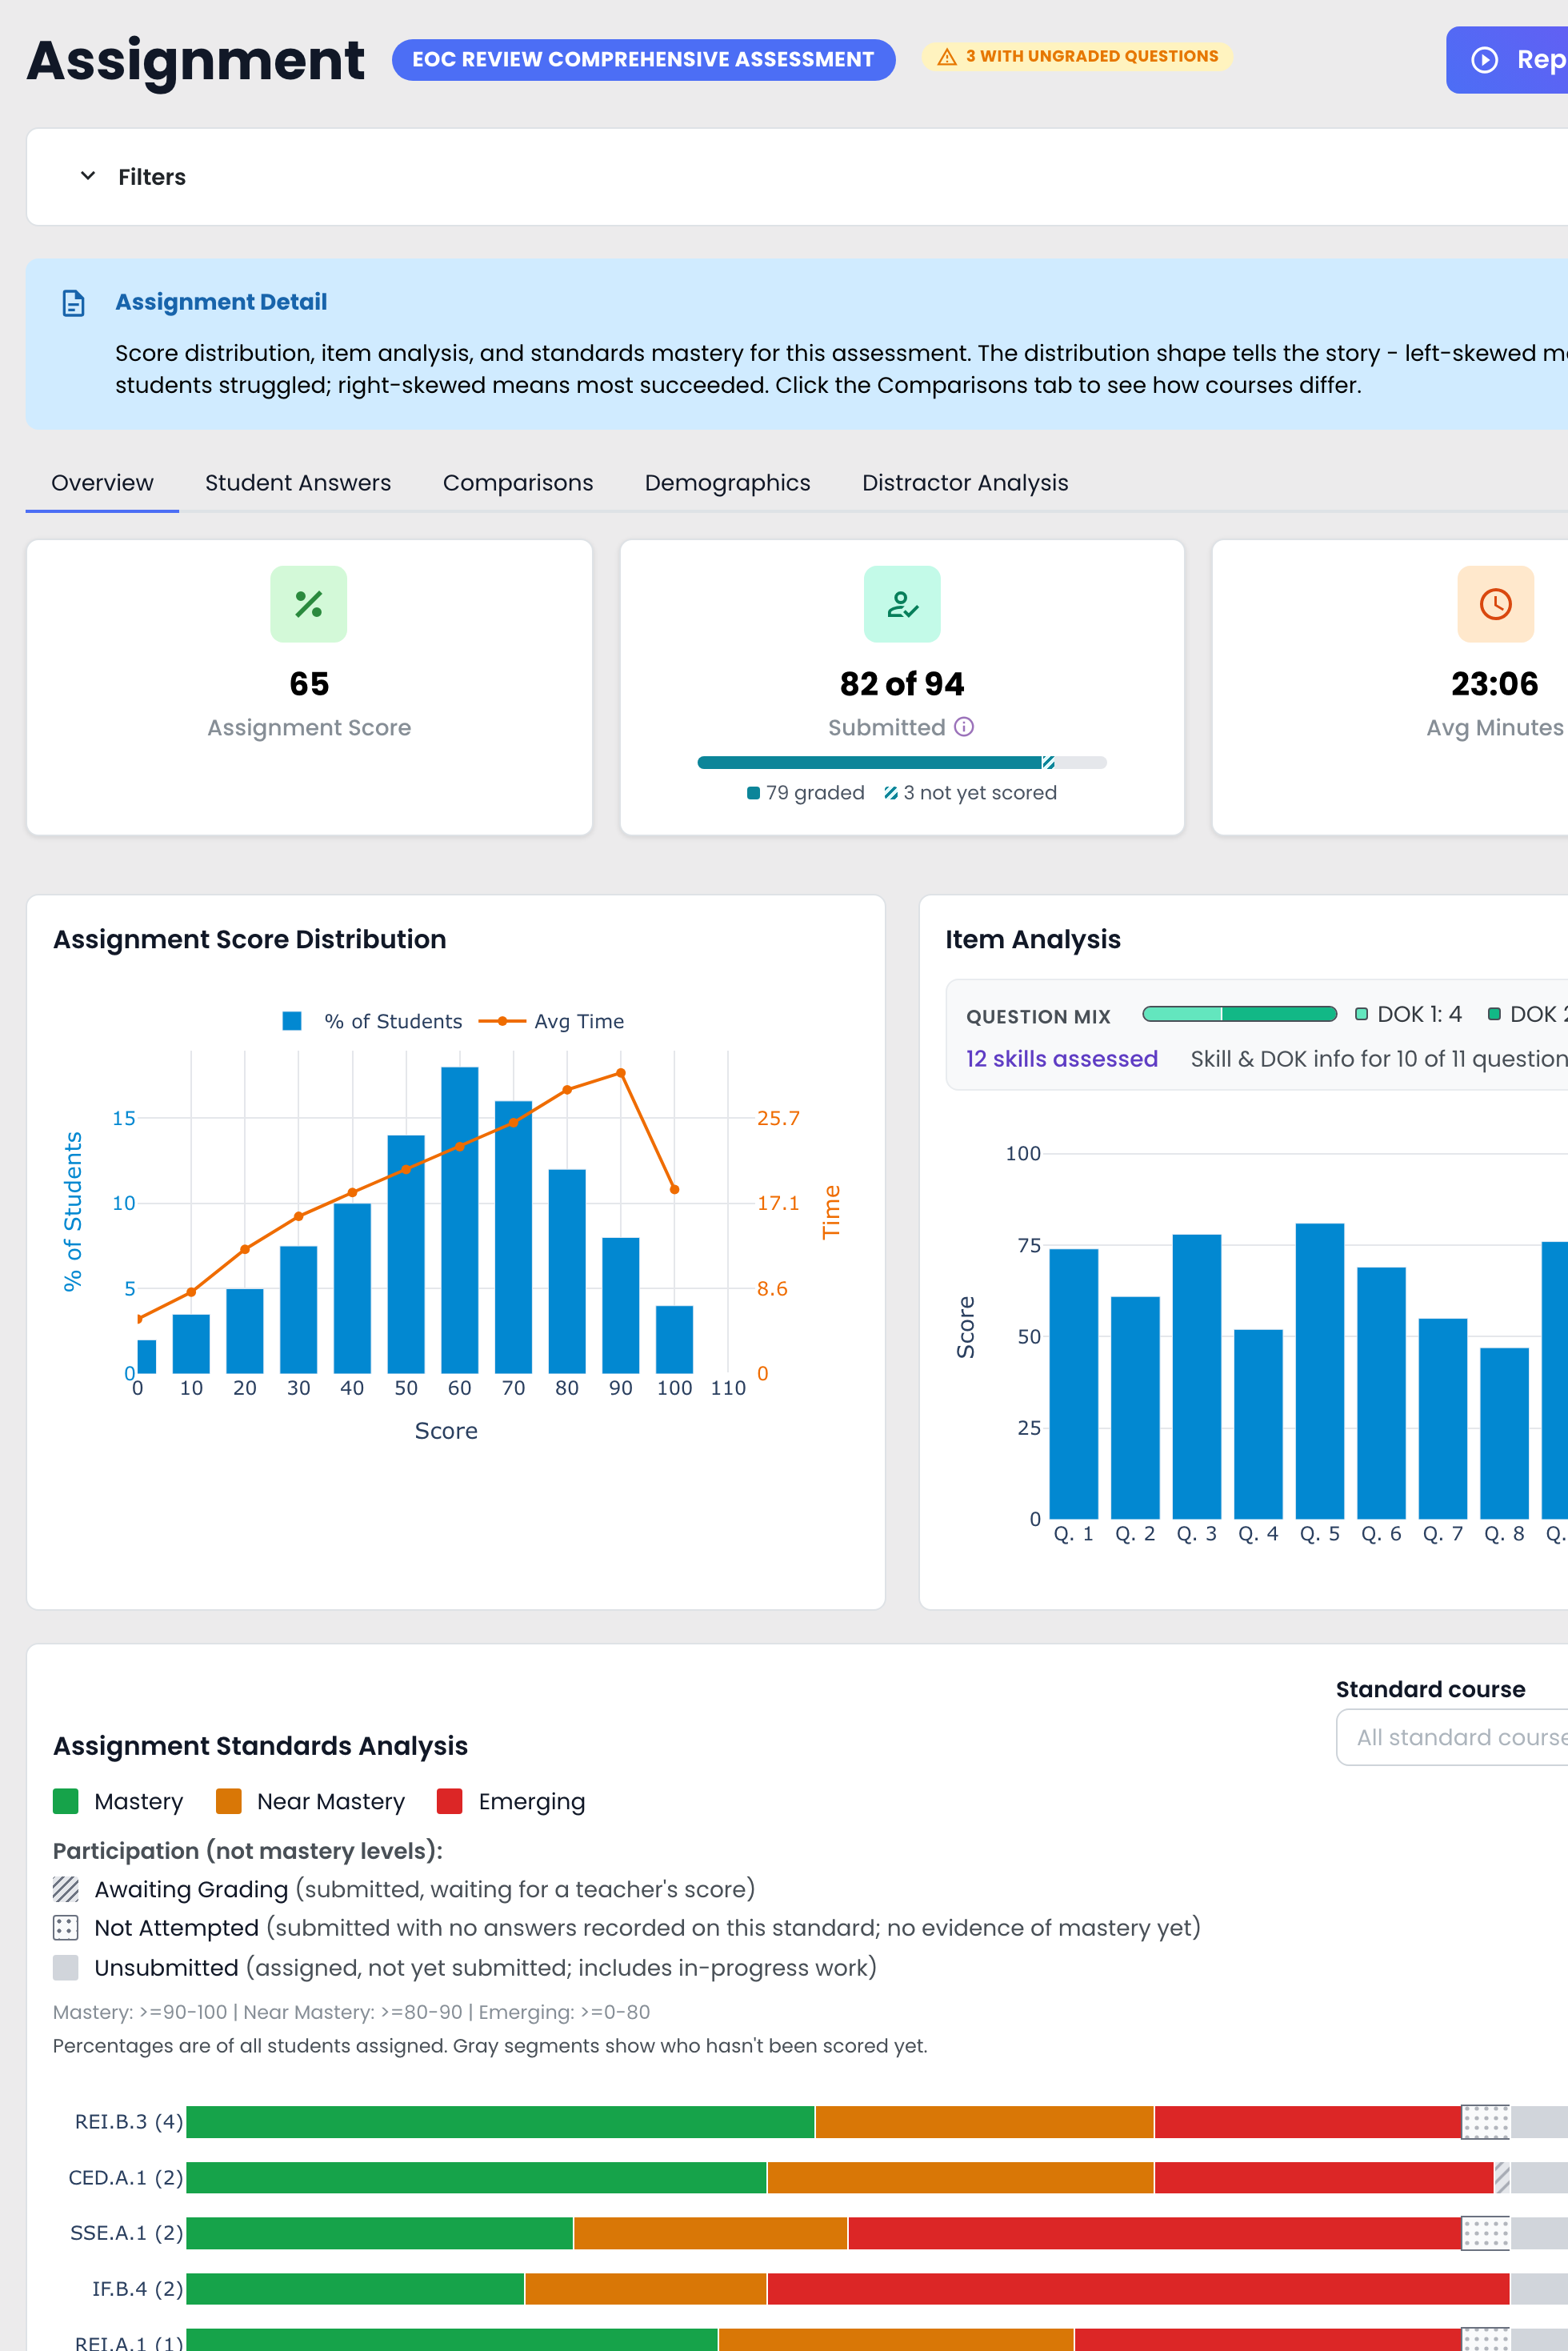
- Overview — the headline: Assignment Score 65, 82 of 94 Submitted (79 graded, 3 not yet scored), and average time 23:06. Glance at Submitted first — it tells you whether enough of the class has finished for the score to be worth acting on. The Score Distribution shape tells the story at a glance — left-skewed means most students struggled; right-skewed means most got it. Below it, Item Analysis ranks the questions so a low-performing item jumps out; the Question mix strip above the chart shows the test's Depth of Knowledge (DOK) balance and how many skills it assesses, and hovering a question adds its skills and rigor (DOK and SOLO). Assignment Standards Analysis shows mastery per standard — when the items carry standards from more than one course, pick yours in the Standard course filter (here Algebra 1 or Algebra 2) to keep the view on your course.
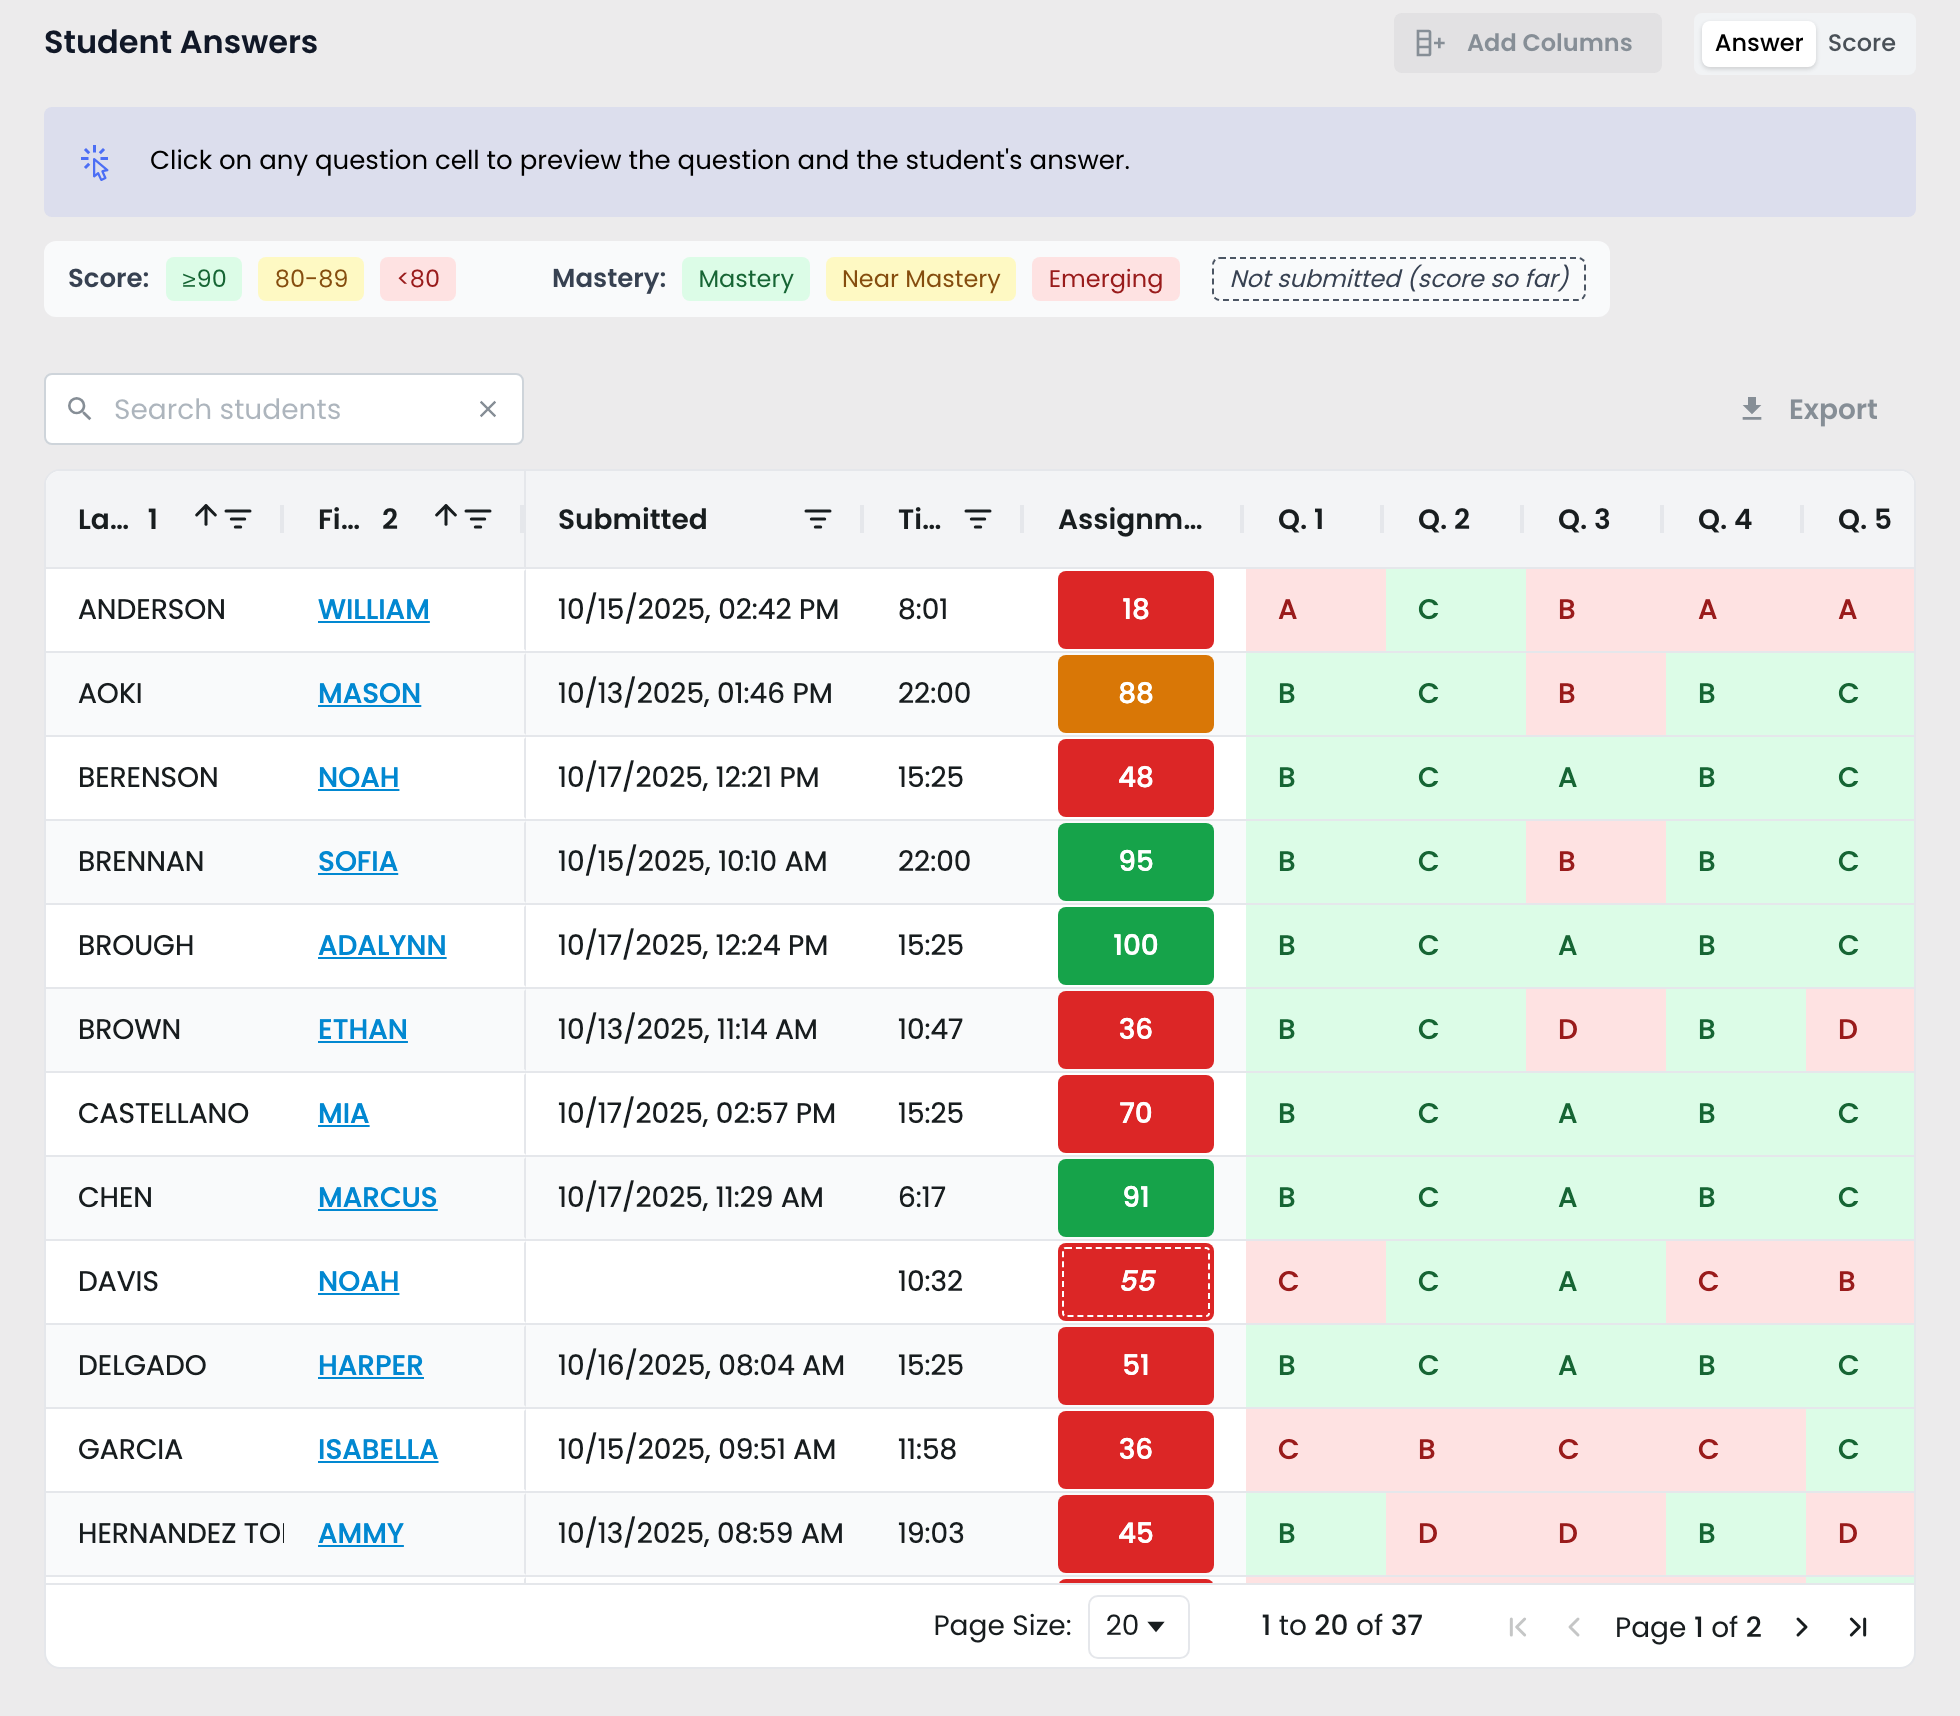
- Student Answers — every student's response, item by item, color-coded right/wrong. Students are listed A–Z by last name, with a Search students box to jump straight to one, and Submitted shows each student's own submission date and time. A dashed, italic score is Not submitted (score so far) — work the student started but hasn't turned in (here Noah Davis, 55) — so follow up on the submission before reading it as a final score. Click any question cell to open the exact question and that student's actual answer, with the skill it assesses and its rigor (DOK and SOLO) above it — the individual, per-student counterpart to the class-wide Question Replay.
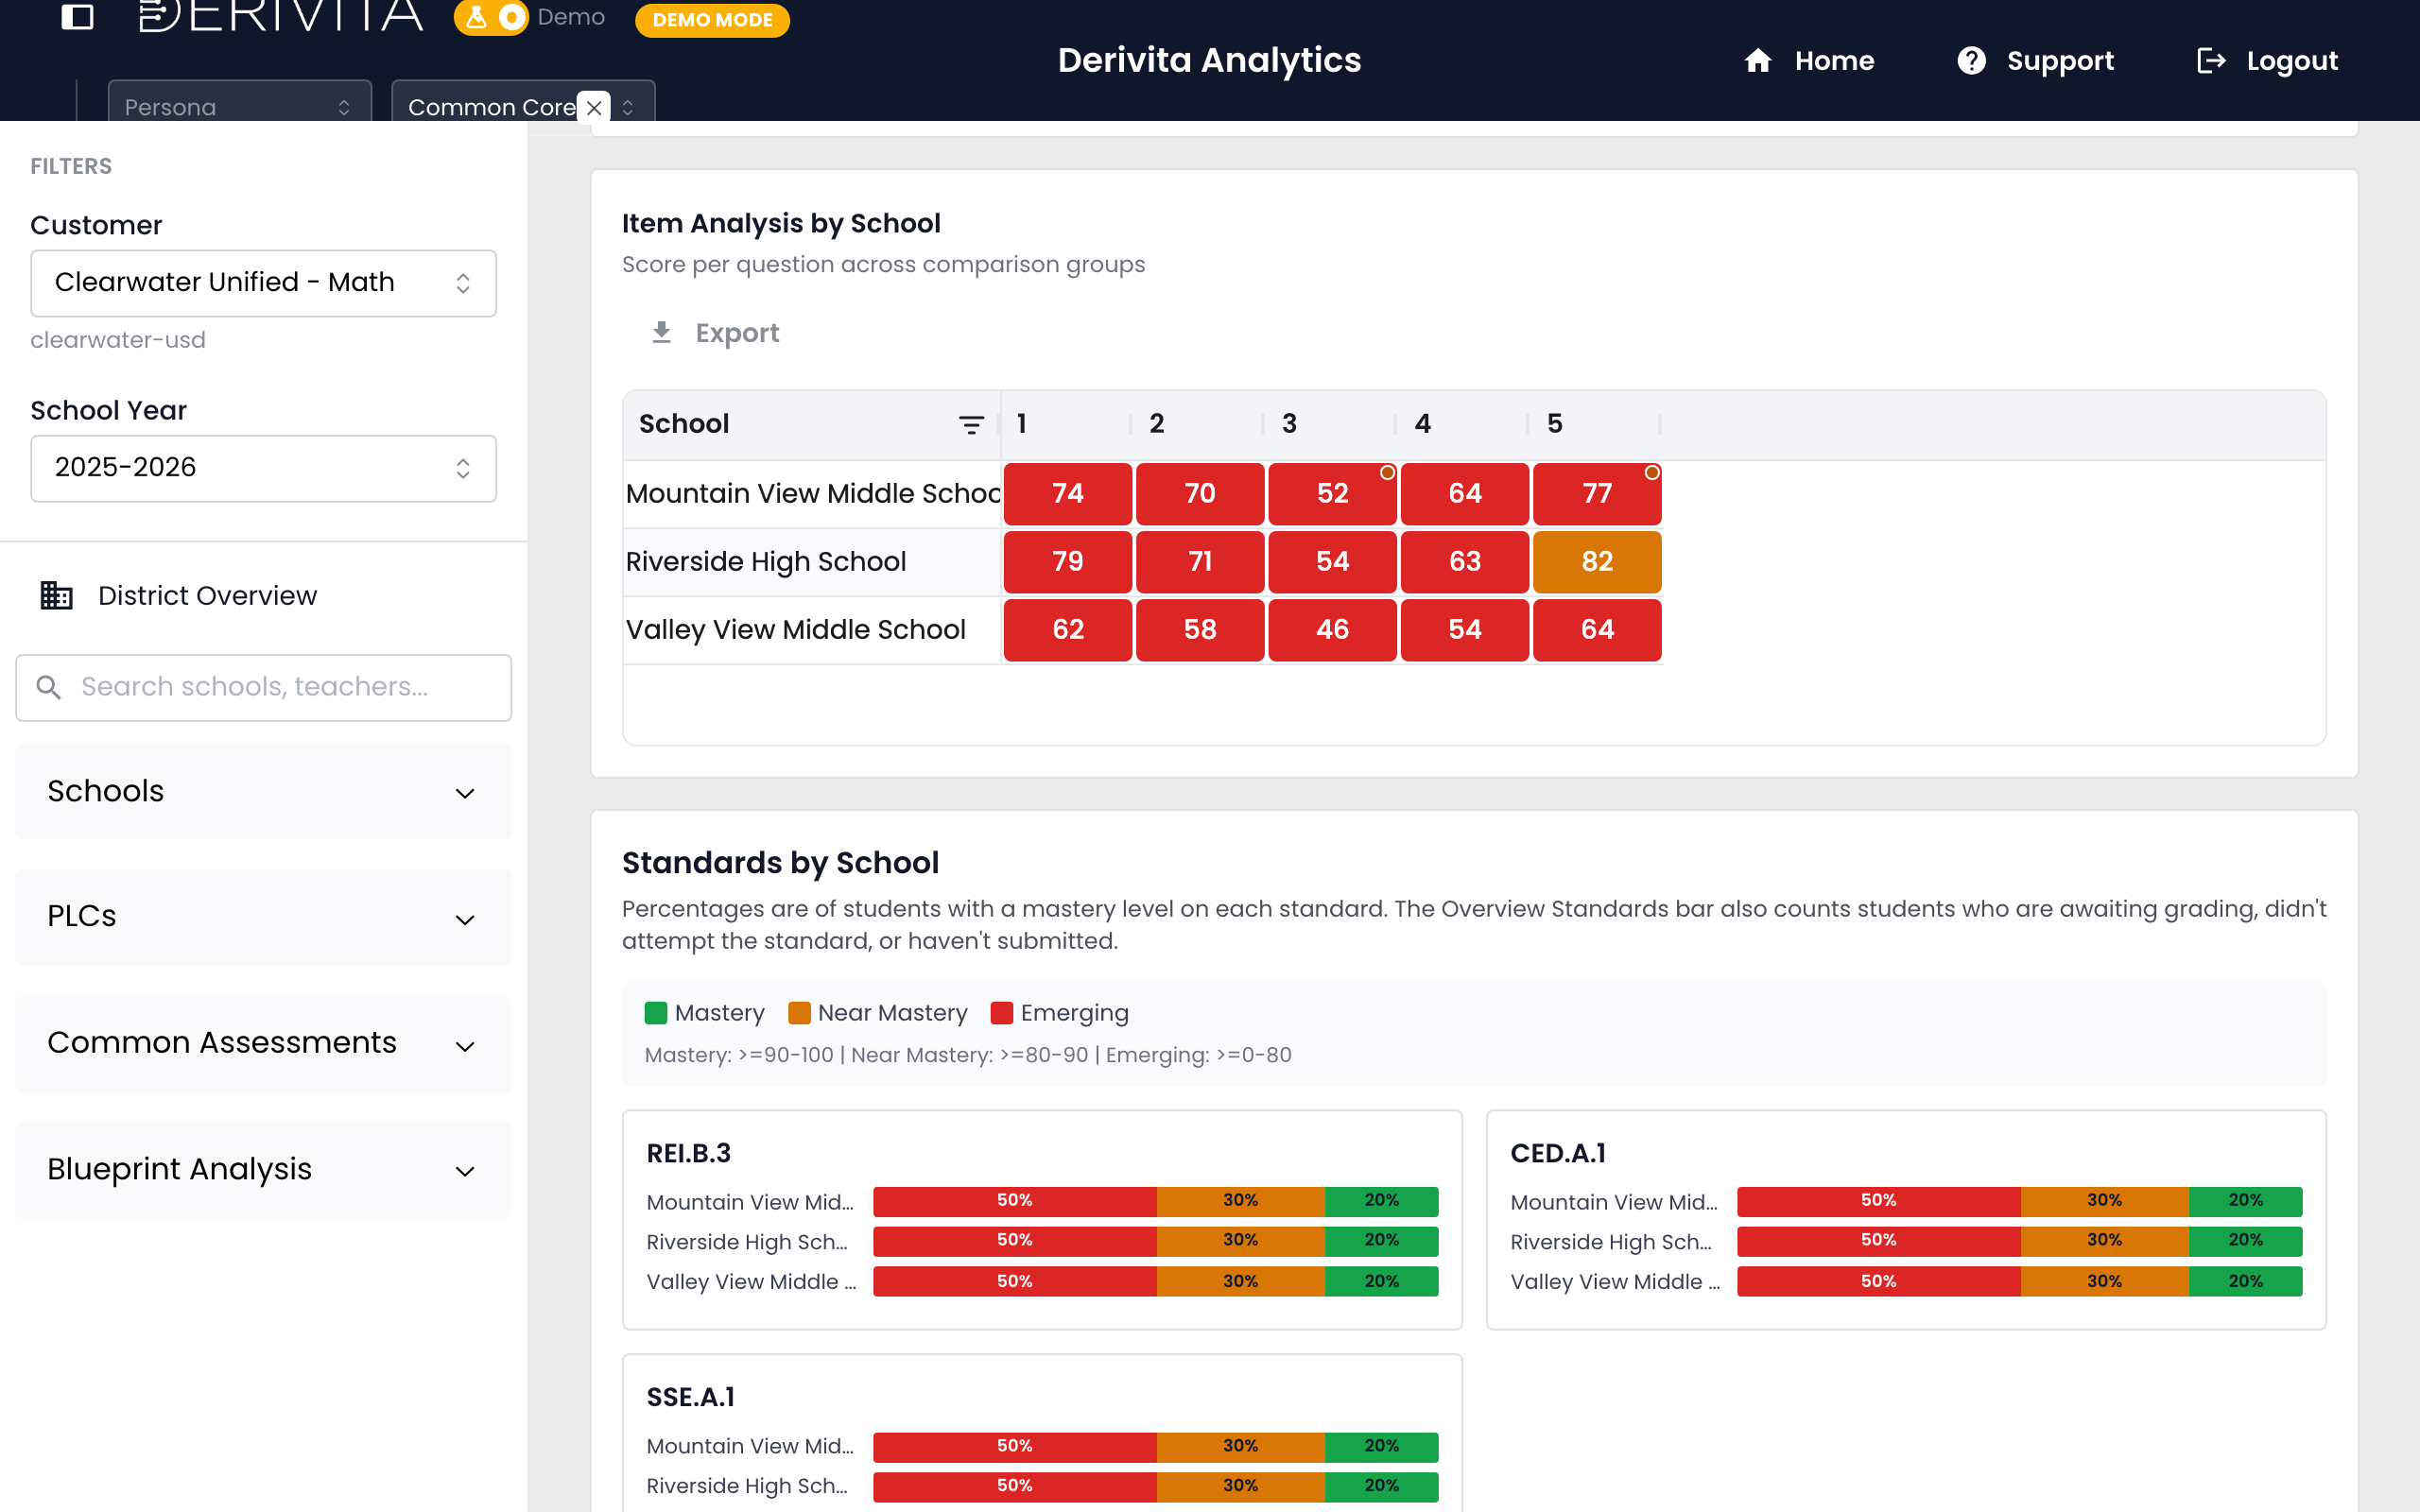
- Comparisons — the same assessment by section, school, or instructor, each with a per-standard mastery breakdown, so a gap between periods or campuses is obvious. At the Instructor level, each instructor's name links straight to their teacher dashboard. In the Item Analysis by grid, a cell with ungraded responses carries a small corner marker, so a low-looking cell isn't misread as wrong answers when it's really still awaiting grading.
 - Demographics and Distractor Analysis round it out — subgroup performance, and which wrong answers students clustered on.
Start with the Distribution + Item Analysis to find the one or two items that dragged the score, then open Student Answers to see who missed them. That pair — weak item, and the students on it — is your reteach, already isolated.
Related- Your class: What to do Monday — your reteach list
- Drill in: How is this standard doing?
- Why they missed it: Question Replay