![derivita-logowhite (2).png]](https://support.derivita.com/hs-fs/hubfs/derivita-logowhite%20(2).png?height=25&name=derivita-logowhite%20(2).png)
A blueprint can show dozens of standards, and plenty of them in red. Reteaching all of them isn't an option — and the standard with the lowest mastery often barely counts toward the exam. The Impact Score answers the one question that turns a wall of data into a decision: where does the next hour of reteaching actually move readiness?
What the Impact Score measures
An Impact Score fuses two things into a single, signed number:
- Exam weight — how much the standard's domain counts toward the end-of-course exam.
- Mastery gap — how far your students are from mastering it.
A standard drags readiness down only when it's both heavily weighted and under-mastered. A low-mastery standard that barely counts won't top the list; a heavily-weighted standard students haven't cracked will. That's what makes the Impact Score a place to spend time, not just a number to read — the same attainment × coverage logic behind the readiness score, turned into a priority.
The sign tells you which way a standard is pushing:
- Negative — dragging down — the standard is pulling readiness below where it could be. These are your biggest reteach opportunities.
- Positive — lifting up — the standard is already working. A bright spot to learn from, not to spend on.
Scope: impact is read for the whole cohort on the blueprint — here, all 680 Algebra 1 students — not one student at a time. So it points to where a team's reteach time and a leader's coaching budget go.
Where to find it
- Open Blueprint Analysis and select a blueprint (e.g. Algebra 1 EOC).
- The KPI strip reads the blueprint in one line — Readiness 63 · Attainment 74 · Coverage 85%.
- Scroll to Standards Performance — "Standards influencing readiness most (by impact), with mastery distribution."
- Stay on Highlights for the biggest drags and bright spots, or switch to All Standards for the full ranking.
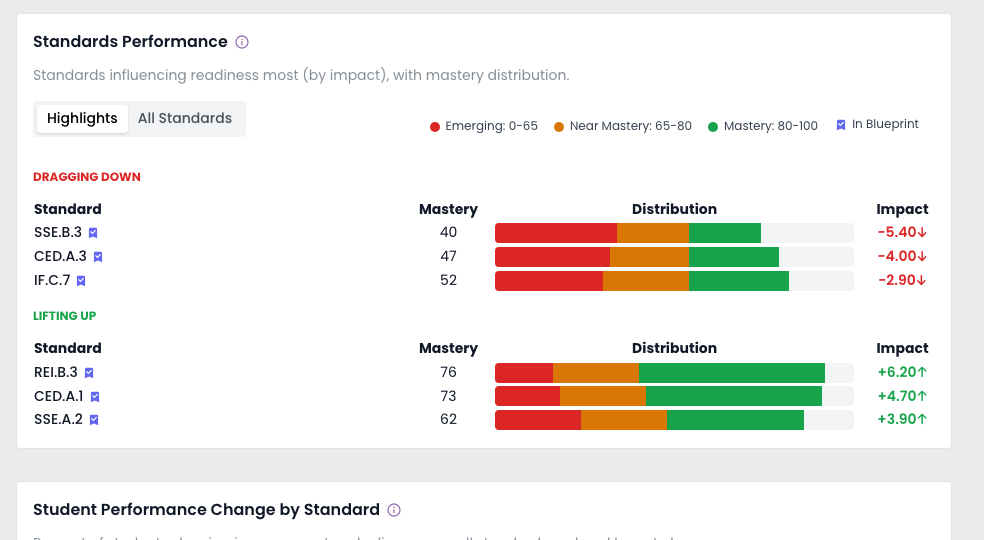 Standards Performance — standards ranked by impact, biggest drags and bright spots
How to read it
The Standards Performance highlights split into two columns — each standard shown with its mastery distribution and its impact:
- Dragging down — SSE.B.3 is the single biggest drag at −5.40, because it sits in a heavily-weighted domain (Structure in Expressions, 25% of the exam) the cohort hasn't mastered yet (40% mastery). That's the reteach priority. CED.A.3 (−4.00) and IF.C.7 (−2.90) follow.
- Lifting up — REI.B.3 is the top bright spot at +6.20 (76% mastery) — the thing already working, and the model to learn from. CED.A.1 (+4.70) and SSE.A.2 (+3.90) follow.
The takeaway isn't "fix everything." It's fund one: aim the next reteach, PLC session, or coaching hour at the standard on top of Dragging down.
Take action
- Reteach the top drag first — click the standard to open its detail and see exactly which students are behind on it.
- Group students by shared focus areas — students emerging on the same standard are a ready-made small group.
- Learn from the bright spots — the section or teacher already strong on a lifting-up standard is who to pair for PD.
The same score, every role
Impact reads the same way at every level — only the decision changes:
- District / curriculum leader — the domain dragging across schools → where coaching budget and curriculum focus go.
- Principal — the building's reteach priority, and which teachers are already strong → who to pair.
- PLC / teacher — the standard to reteach next, and the section that already has it working.
Same ranked list, three altitudes, one shared priority — no arguing about which standard.
Impact Score vs. Mastery Score
| Metric | What it measures | Scope |
|---|---|---|
| Mastery Score | How well the cohort has mastered one standard | One standard |
| Impact Score | How much that standard is moving overall readiness | All standards → one readiness number |
Can a well-mastered standard still have low impact? Yes — a standard the cohort has largely mastered, or one that's lightly weighted in the blueprint, moves readiness very little even at high mastery. Impact only spikes when weight and gap are both high.
Is the Impact Score just an average? No. It's a weighted measure of how each standard affects predicted readiness (exam weight × mastery gap), not a simple average of scores.
▶ VIDEO