![derivita-logowhite (2).png]](https://support.derivita.com/hs-fs/hubfs/derivita-logowhite%20(2).png?height=25&name=derivita-logowhite%20(2).png)
For PLC leads and department chairs: the Blueprint Analysis tab gives your whole cohort one honest number against the end-of-course exam — and, more importantly, tells the team whether a low number means keep teaching or reteach.
Get there- Open your PLC (here, the Algebra 1 PLC) and click the Blueprint Analysis tab.
- Your end-of-course subject shows as one row. - The line above the tabs names your PLC's subject (here, Algebra 1), and this tab is scoped to it. If it lists a course with no subject set, ask your district admin to map one so that course's students count too.
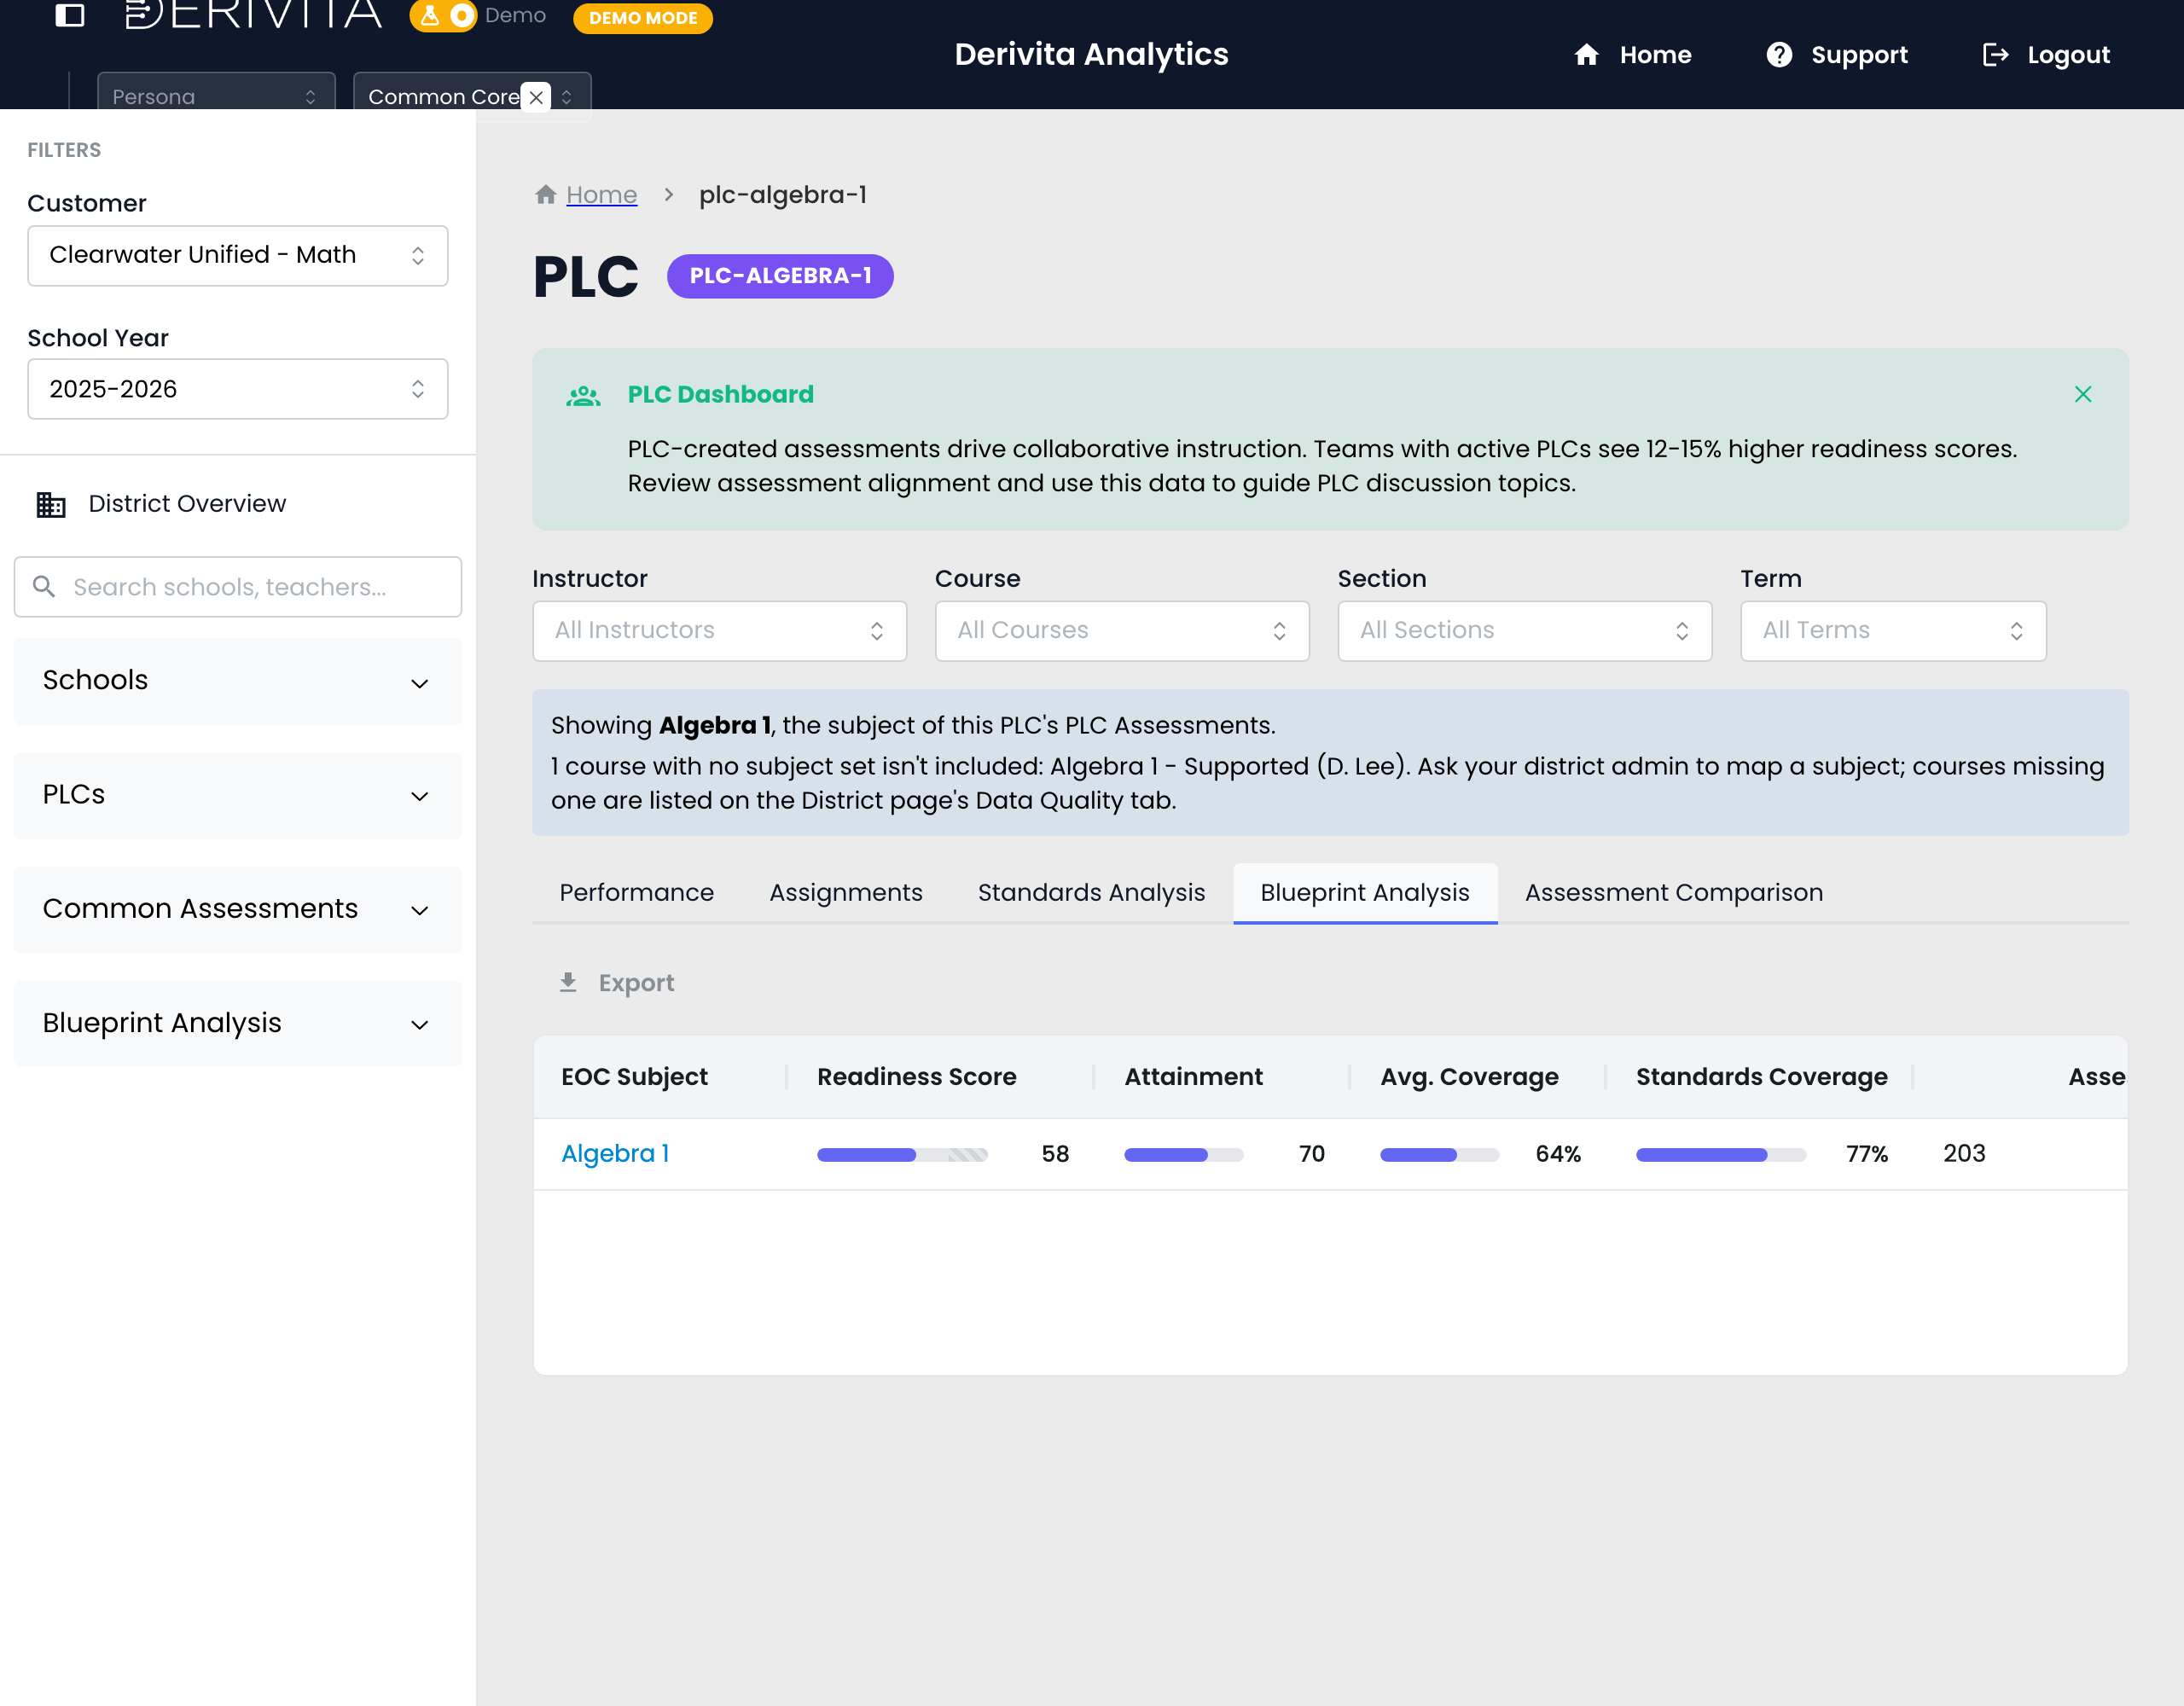
Four numbers, read together, are the whole meeting:
- Readiness 58 — the cohort's outlook on the Algebra 1 exam.
- Attainment 70 — how well they've mastered what's been taught so far.
- Coverage 64% · Standards Coverage 77% — how much of the blueprint has been taught/assessed.
Attainment (70) sits well above readiness (58), and coverage is only 64% — so the gap is pacing, not mastery. Students are learning what the team is teaching; there's just more blueprint left to cover. That's a "keep going, prioritize the un-taught weight" conversation — not a "we're failing" one.
The one moveRead attainment vs readiness first: a big gap (like 70 vs 58) with mid coverage means the fastest readiness lift is teaching the heavily-weighted standards you haven't reached yet — a pacing decision for the team. Click Algebra 1 to drill in and pull the single standard to reteach at Tuesday's meeting.
Related- Concept: Understanding the Blueprint Readiness Score
- District view: Find the standards dragging down the whole district
- Reference: why some subjects show Readiness vs Mastery