![derivita-logowhite (2).png]](https://support.derivita.com/hs-fs/hubfs/derivita-logowhite%20(2).png?height=25&name=derivita-logowhite%20(2).png)
For coordinators and equity leads: Readiness by Demographic breaks the blueprint readiness number out by subgroup — so you can see which groups are behind, and, just as important, why.
Get there- Open the Algebra 1 EOC blueprint.
- Use the Demographics dimension (Grade, Ethnicity, Gender) to break the view out by subgroup.
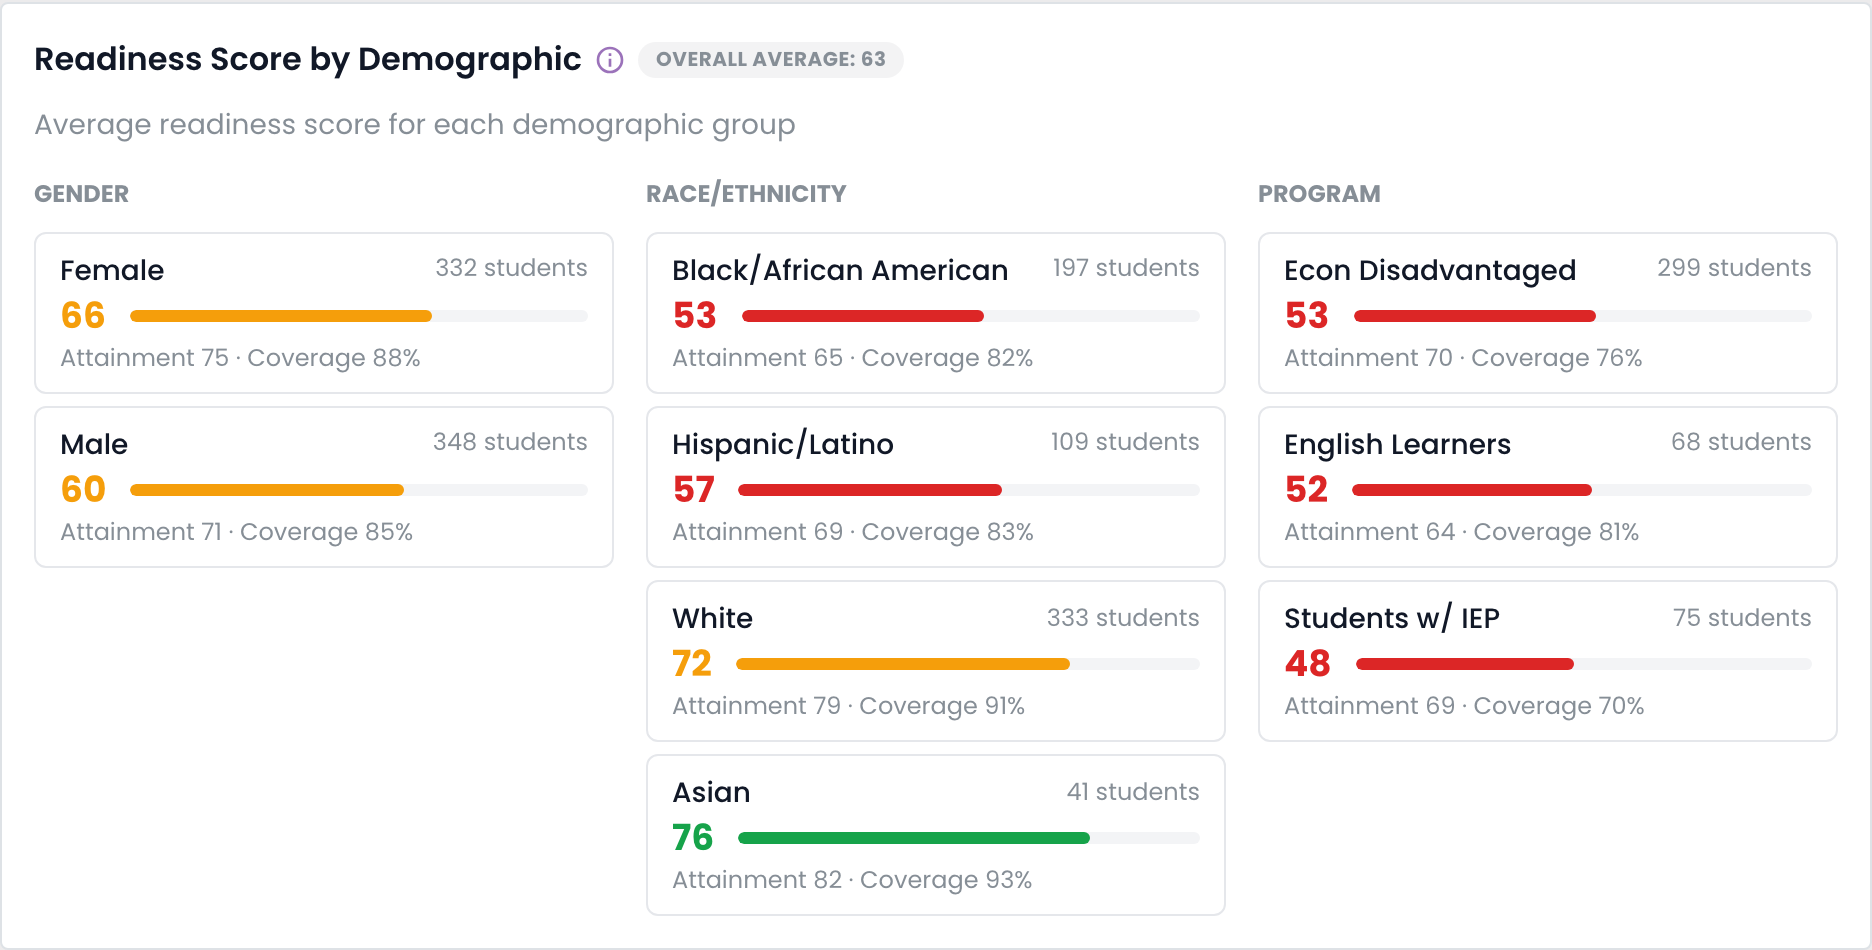 Readiness broken out by subgroup on the blueprint
- Readiness is split by subgroup across Gender, Race/Ethnicity, and Program, against an overall average of 63 — so a gap between groups is visible instead of hidden inside the average. Here the furthest-behind groups are Students w/ IEP (48 — 15 points below average), English Learners (52), and Econ Disadvantaged (53), while Asian (76) and White (72) sit well above.
- The point isn't just the size of the gap — it's the kind. Each card carries Attainment and Coverage beside the readiness score, so you can tell them apart: Students w/ IEP are low on both (attainment 69, coverage 70% — the lowest coverage of any group), so they're being taught less of the blueprint and mastering less — an access problem first. Compare that to a group that's high-coverage but lower-attainment, where the fix is reteaching, not scheduling.
- Small subgroups are suppressed below a threshold to protect student privacy, so you'll see counts hidden where a group is too small to report.
Find the widest subgroup gap, then decompose it: if it's coverage, the group is being taught less of the blueprint — a scheduling/access fix; if it's attainment, they're being taught it but not mastering it — a support/reteach fix. Target the cause, not the number.
▶ VIDEO
Related- Pacing vs teaching: Is this a pacing gap or a teaching gap?
- Concept: What is Blueprint Readiness?
- For a principal: Your subject's full picture